
Monte Carlo
Founded Year
2019Stage
Series D | AliveTotal Raised
$236MValuation
$0000Last Raised
$135M | 2 yrs agoMosaic Score The Mosaic Score is an algorithm that measures the overall financial health and market potential of private companies.
-51 points in the past 30 days
About Monte Carlo
Monte Carlo provides a data observability platform that detects, resolves and prevents data downtime, providing visibility and interoperability between data tools. Monte Carlo primarily serves sectors such as financial services, healthcare and life sciences, technology, advertising, media, and entertainment. The company was founded in 2019 and is based in San Francisco, California.
Loading...
Monte Carlo's Product Videos


ESPs containing Monte Carlo
The ESP matrix leverages data and analyst insight to identify and rank leading companies in a given technology landscape.
The data quality monitoring market offers a range of tools and platforms designed to help organizations measure, fix, and use trusted data in their day-to-day operations. It involves continuous monitoring and analysis of data to detect and resolve issues promptly, as well as the establishment of metrics and performance indicators to measure and track data quality over time. By automatically monito…
Monte Carlo named as Outperformer among 15 other companies, including IBM, Snowflake, and Databricks.
Monte Carlo's Products & Differentiators
Monte Carlo Data Observability Platform
Monte Carlo’s Data Observability Platform automatically monitors and alerts for data issues across your warehouses, lakes, ETL, and business intelligence tools. Monte Carlo also provides automatic, field-level lineage, root cause analysis, and centralized data cataloging to better understand the accessibility, location, health, and ownership of their data.
Loading...
Research containing Monte Carlo
Get data-driven expert analysis from the CB Insights Intelligence Unit.
CB Insights Intelligence Analysts have mentioned Monte Carlo in 3 CB Insights research briefs, most recently on Jul 31, 2023.
Jul 31, 2023
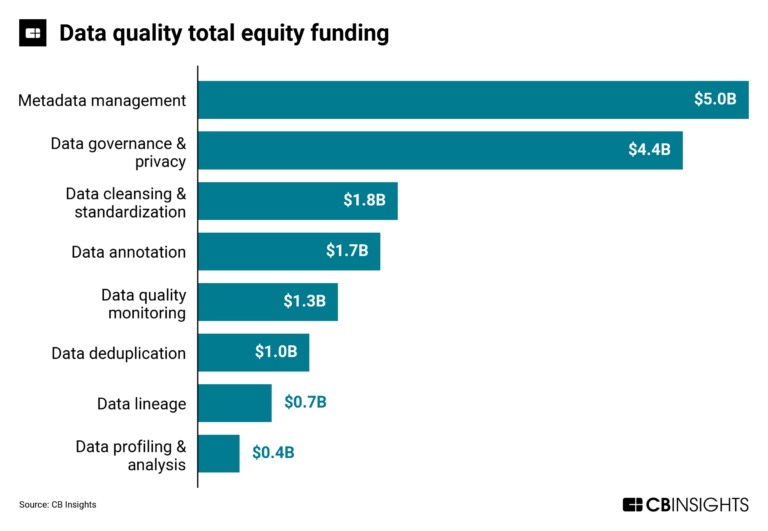
The data quality market map

Expert Collections containing Monte Carlo
Expert Collections are analyst-curated lists that highlight the companies you need to know in the most important technology spaces.
Monte Carlo is included in 3 Expert Collections, including Unicorns- Billion Dollar Startups.
Unicorns- Billion Dollar Startups
1,249 items
AI 100
100 items
Artificial Intelligence
6,855 items
Latest Monte Carlo News
Oct 24, 2024
24 October 2024 Interpreting the biological effects of protons as a function of physical quantity: linear energy transfer or microdosimetric lineal energy spectrum? Abstract The choice of appropriate physical quantities to characterize the biological effects of ionizing radiation has evolved over time coupled with advances in scientific understanding. The basic hypothesis in radiation dosimetry is that the energy deposited by ionizing radiation initiates all the consequences of exposure in a biological sample (e.g., DNA damage, reproductive cell death). Physical quantities defined to characterize energy deposition have included dose, a measure of the mean energy imparted per unit mass of the target, and linear energy transfer (LET), a measure of the mean energy deposition per unit distance that charged particles traverse in a medium. The primary advantage of using the “dose and LET” physical system is its relative simplicity, especially for presenting and recording results. Inclusion of additional information such as the energy spectrum of charged particles renders this approach adequate to describe the biological effects of large dose levels from homogeneous sources. The primary disadvantage of this system is that it does not provide a unique description of the stochastic nature of radiation interactions. We and others have used dose-averaged LET (LETd) as a correlative physical quantity to the relative biological effectiveness (RBE) of proton beams. This approach is based on established experimental findings that proton RBE increases with LETd. However, this approach might not be applicable to intensity-modulated proton therapy or other applications in which the proton energy spectrum is highly heterogeneous. In the current study, we irradiated cancer cells with scanning proton beams with identical LETd (3.4 keV/µm) but arising from two different proton energy/LET spectra (a narrow spectrum in group 1 and a widespread heterogeneous spectrum in group 2). Clonogenic survival after irradiation revealed significant differences in RBE at any cell surviving fraction: e.g., at a surviving fraction of 0.1, the RBE was 0.97 ± 0.03 in group 1 and 1.16 ± 0.04 in group 2 (p≤0.01), validating our hypothesis that LETd alone may not adequately indicate proton RBE. Further analysis showed that microdosimetric spectrum (the probability density function of the stochastic physical quantity lineal energy y) was helpful for interpreting observed differences in biological effects. However, more accurate use of microdosimetric spectrum to quantify RBE requires a cell line–specific mechanistic model. Introduction The relative biological effectiveness (RBE) of protons versus reference photons in current clinical applications is a constant value of 1.1 1 – 5 regardless of proton beam characteristics, depth, dose, and target tissue and cell types. In proton therapy treatment planning systems, the prescribed dose is expressed in the units of Gy (RBE) by multiplying 1.1 to the absorbed dose 3 . This constant RBE of 1.1 was derived from previous experimental findings obtained mainly at the middle of a spread-out Bragg peak (SOBP) region from passive-scattering proton therapy (PSPT) beams. However, the use of this constant RBE of 1.1 has been skeptical. More recent studies have investigated the biological effects of therapeutic proton beams along the beam path as a function of linear energy transfer (LET). A mainstream viewpoint so far is that the RBE of proton beams monotonically increases with the dose-averaged LET (LETd), rather than a constant value. This conclusion was reached by irradiating cells along proton beam paths using either an SOBP or a pristine Bragg curve 6 , 7 , 8 . Several mathematical RBE models have been developed that use LETd as an input parameter to indicate the beam quality for predicting the biological effects of proton beams 9 , 10 , 11 , 12 ; these models suggest that the same combination of dose and LETd will result in the same biological effects, despite the spread of the LET spectrum. In addition, these LET-dependent models are extremely ion species dependent, i.e., limited to proton beams only, and, for this reason, are mainly suited for in-field and monoenergetic proton beams (or with a narrow energy/LET spectrum) and cannot be easily generalized and extended to heavier ions such as helium and carbon ions. The advent of intensity-modulated proton therapy (IMPT) involving scanning proton beams has rendered this assumption (same LETd resulting in same RBE) questionable because the IMPT dose at a given location is deposited by different beamlets that have heterogeneous proton energy spectra and thus LET spectra, i.e., multiple distinguishable energy or LET distributions in the composite spectrum. Theoretically, the same mean value of LETd can be derived from any number of different LET spectra. However, because each LET value in the spectrum could have different biological effects, it is debatable to assume LET spectra with same LETd will be biologically equivalent. Indeed, using LET as a quantitative indicator of the RBE of charged particles is itself of questionable value 13 , 14 , 15 . One of the reasons for the use of LET in particle radiobiology has been its conceptual simplicity and convenience. However, caution is needed when applying LET to predict RBE because doing so may result in misleading conclusions 15 , 16 . The committee of the International Commission on Radiation Units and Measurements (ICRU) Report No. 78 (Jones et al., 2007) stated that LET has proven useful for understanding variations in RBE, but LET does not accurately predict biological response in different cell or tissue systems 3 . The ICRU Report No. 86 (Braby et al., 2011) also points out that the use of (non-stochastic) macroscopic physical quantities such as dose and LETd obscures the finer details of the interactions between ionizing particles and the biological system (e.g., a cell or DNA within a cell) 17 . Alternatively, microdosimetry, which uses the stochastic physical quantities lineal energy and specific energy, can provide the spectral distribution of energy deposited from individual particle tracks at small sites. Thus ICRU Report No. 98 (Braby et al., 2023) recommends the use of microdosimetry to assess particle therapy RBE 18 . With the goal of eliminating ambiguities in linking physical quantities with consequent biological effects, we have performed a simple but rigorous physics-driven biological experiment. The first purpose in the current study was to experimentally validate our hypothesis that LETd alone may not be an appropriate physical quantity to indicate the biological effects of proton beams. We designed an experiment in which lung cancer cells were irradiated with identical LETd arising from very different LET spectra in two specific proton beam setups. Clonogenic assay of cell survival was used to compare the biological outcome of these two setups, and a distinguishable difference (statistically significant) in cell survival was observed. The second purpose of the current study was to validate our hypothesis that microdosimetric spectra are more appropriate than LETd and dose-mean lineal energy (\(\:{\stackrel{-}{y}}_{D}\)) for linking physical quantities to biological effects. Our Monte Carlo simulation results showed that the difference in lineal energy spectra in the two setups could better explain the observed differences in cell survival and RBE. Many previous studies, including our own, have focused on correlating proton biological effects with the average physical quantities of dose and LETd. The significance of the current study, in contrast, lies in experimentally addressing the potential role of detailed microdosimetric spectra in interpreting clonogenic cell survival and RBE. Materials and methods Principles for the proton irradiation experiments The first hypothesis of this work is that irradiations with identical LETd but different proton energy/LET spectra may not produce the same biological effects. To test this hypothesis, we designed experiments to irradiate lung cancer cells to two different proton energy/LET spectra but identical LETd and compared the biological effects. Physical parameters for this study were calculated with our measurement-validated, Geant4-based Monte Carlo platform for the spot-scanning proton nozzle at the Proton Therapy Center 1 of The University of Texas MD Anderson Cancer Center 19 . Calculations obtained before the cell irradiation experiments described the basic physical quantities dose and LETd in a water phantom (40 cm × 40 cm × 40 cm) irradiated by a large uniform field (18 cm × 18 cm, with spots separated by 0.9 cm). Details are published elsewhere 20 . The dose and LETd distributions along the central axis of the water phantom were then used to design the cell-irradiation experiments. Two experimental setups with the same target LETd but different proton energy/LET spectra were defined as S1 and S2. The S1 setup involved using a 127.4-MeV beam and a target LETd value of 3.4 keV/µm at a depth of 11.14 cm (proximal to its Bragg peak) in water. The S2 setup involved using two initial beam energies (127.4 MeV and 136.4 MeV) to form a mixed radiation field with a composite proton energy/LET spectrum, with a target depth of 11.53 cm in water. The LETd of the 127.4 MeV beam was 11.4 keV/µm at a depth of 11.53 cm (at the distal edge of its Bragg peak). The LETd of the 136.4 MeV beam was 1.52 keV/µm at a depth of 11.53 cm (proximal to its Bragg peak). Then, the dose weighting factor of each beam was solved to make the target LETd of the mixed beams equal to 3.4 keV/µm (as set in S1). The solved dose weighing factors were 0.185 for the 127.4 MeV beam and 0.815 for the 136.4 MeV beam (calculations provided in Supplementary Materials ). The weighted dose curves in water from the S2 setup, with 127.4 MeV and 136.4 MeV proton beams and their sum, are shown in Fig. 1 A; the dose curves in S1 and S2 are compared in Fig. 1 B. The depth LETd curves in water from the 127.4 MeV and 136.4 MeV proton beams are shown in Fig. 2 A; the LETd curves for S1 and S2 are compared in Fig. 2 B. Fig. 1 (A) Weighted depth dose curves from 127.4 MeV beam (dose weighting factor = 18.5%, black) and 136.4 MeV (dose weighting factor = 81.5%, green), and the sum depth dose curve (red) in setup S2. (B) Depth dose curves in setup S1 (127.4 MeV) and S2 (mixed beams of 127.4 and 136.4 MeV). Fig. 2 (A) The depth LETd curves in water from 127.4 MeV (blue) and 136.4 MeV (green) proton beams. At a depth of 11.14 cm, the LETd was 3.4 keV/µm from the 127.4 MeV beam. At a depth of 11.53 cm, the LETd from the 127.4-MeV beam was 11.4 keV/µm, and that from the 136.4-MeV beam was 1.52 keV/µm. (B) The target LETd was 3.4 keV/µm for setups S1 (single 127.4 MeV at the depth of 11.14 cm in water) and S2 (mixed beams of 127.4 MeV and 137.4 MeV at the depth of 11.53 cm in water). Irradiation device design The depth in a water phantom for the irradiation experiments in S1 and S2 were determined as described above. Two Lucite slabs were then used as range shifters to make the cell irradiation depth equal to the designed value (Fig. 1 B). In the actual cell irradiation, cells were cultured in 96-well polystyrene plates (1.24 ± 0.015 mm thick), and thus the thickness of the well bottoms was also considered in the experimental design. The total water equivalent thickness (WET) of a Lucite slab and the well bottom was made to equal the specified water depth in Fig. 1 B for each setup. The nominal density of Lucite and polystyrene was set to 1.19 and 1.09 g/cm3, respectively 21 , 22 . Their corresponding WET conversion factors (obtained via our Monte Carlo simulation) were 1.18 and 1.08. The calculated required physical thickness of the Lucite slabs in S1 was 93.22 mm and that for S2 was 96.61 mm. The Lucite slabs were fabricated with a high-accuracy (± 3 μm) milling machine. The original template was a cuboid block (21 cm × 19 cm × 11 cm). The physical thickness of slabs was measured with a caliper (precision 0.01 mm) indicated by an oil-pressure gauge at our machine shop. Slab thickness was measured at nine different locations in each slab and found to be 93.22 ± 0.10 mm in S1 and 96.61 ± 0.10 mm in S2. Geant4 Monte Carlo simulations were then performed for both cell irradiation setups (S1 and S2). The proton nozzle, Lucite block, and 96-well cell culture plate were all modeled. A 5-µm thick water layer attached to the well bottom was used to mimic the cell layer for cell dose calculations. The entrance surface of the cell layer was used to score the proton kinetic energy spectrum and LET spectrum. LETd was then calculated based on the LET spectrum. The target LETd values in the S1 and S2 setups were verified to be identical and equal to the designed value (3.4 keV/µm). In addition, another quantity track-averaged LET (LETt) was calculated for comparison, and LETt = 2.9 keV/µm in S1 and 1.8 keV/µm in S2. Experimental setup For irradiation of cells with protons, the bottom of the Lucite slab was placed in the isocenter plane by setting the proton gantry angle to 180 degrees such that the proton beam would come from the bottom of the setup and directly placing the setups on the beam nozzle using the accessory tray of the snout. The 96-well cell culture plate was placed on the top of the Lucite slab, positioned by an index cover to the center of the slab. A spot-scanning field size of 18 cm × 18 cm with a 0.9-cm spot spacing was used to deliver a uniform dose to the entire 96-well plate (dimension 12 cm × 8 cm). Before the cell irradiation, the absolute dose above the Lucite slab (without the 96-well plate) was measured with an Advanced Markus chamber (model 34045, SN 0293) from PTW (Freiburg, Germany) for both the S1 and S2 setups. The difference between the measured dose and Monte Carlo–calculated dose was found to be less than 2% in both setups. Only one plate was irradiated for each exposure (Fig. 3 ). The numbers of monitor units were changed to deliver different dose levels to different plates. After all irradiations in S1 with the 127.4-MeV beam were completed, the S1 slab was replaced by the S2 slab, and cells were irradiated with the 127.4-MeV and 136.4-MeV beams, with precalculated monitor units. Every 96-well plate was returned immediately to the incubator after exposure. Fig. 3 Experimental setup for irradiating cells with protons. A 96-well cell culture plate was placed on the top of a Lucite slab (93.22 mm thick in S1, and 96.61 mm thick in S2). Microdosimetry As noted previously, the use of LET as a quantity to correlate with biological effects is limited because LET is a non-stochastic physical quantity, defined as the average energy loss (due to electromagnetic interactions) per unit length that a specified charged particle of a specified energy, traveled in a medium such as water. This definition limits the application of LET to primary charged particles only. In contrast, the microdosimetric quantity lineal energy (denoted as y) is a stochastic physical quantity to account for energy depositions within a small target (on the micrometer scale), such as a cell or cell nucleus, from all radiation types, including primary and secondary particles: $$y=\frac{{{\varepsilon _s}}}{{\bar {l}}}$$ (1) where εs is the energy deposition from the primary particle and all its secondary particles in a single event within the target volume and \({{\bar {l}}}\) is the mean chord length of the target cell or cell nucleus equal to 2/3 of the diameter if the target is a sphere 18 . Lineal energy is a physical quantity that can account for the radiation quality of a mixed radiation field, which exists in most conditions after the initial monochromatic beam interacts with matter. Because of the stochastic nature of lineal energy, the probability density function of the lineal energy can be calculated or measured. Because the magnitude of lineal energy can cover a wide range (from 10− 1 keV/µm to more than103 keV/µm depending on the radiation type), the log10 scale is usually used for plotting lineal energy spectra 18 , 23 . Dose spectra of lineal energy are most often used in microdosimetric spectrum analysis because the ordinate (dose probability density of lineal energy) stands for the differential dose contribution of the specified lineal energy. The area under the dose spectral curve is proportional to the dose contribution from energy deposition events within the specified range of lineal energy 18 . In our Geant4 Monte Carlo simulation, we modeled a 2-µm diameter sphere at the center of the cell layer (5-µm thick 24 , 25 ) to simulate a cell nucleus 26 , and the microdosimetric spectrum of lineal energy y was scored therein for both S1 and S2. Reference irradiation of cells with photons Reference irradiations with photons were done in parallel with a Cs-137 irradiator (SN 1138, JL Shepherd & Associates, San Fernando, CA). The Cs-137 irradiator has a line source, which is moved under the irradiation chamber when the unit is turned on. In-air dose rates were determined by applying the American Association of Physicists in Medicine (AAPM) TG-61 protocol to the ion chamber measurements. The measured values agreed with the historic reference value within the window of acceptability (± 5%). Sensitivity analysis of the experimental setups The uncertainty of the Lucite slab thickness is 0.10 mm (WET = 0.10 mm × 1.18 = 0.118 mm), and the uncertainty of the cell culture well bottom thickness is 15 μm (WET = 15 μm × 1.08 = 16.2 μm), resulting in a total uncertainty of 0.1191 mm (error propagation) in WET. Here we conservatively assumed the uncertainty in WET to be ± 0.2 mm. The dose curves in Fig. 1 indicate that the dose uncertainty in S1 was within ± 2.5%, and that in S2 was within ± 1.0%. The LETd curves in Fig. 2 indicate that the LETd change in both S1 and S2 was within ± 0.1 keV/µm. If we further extend the uncertainty in WET to ± 0.5 mm by considering possible positioning errors, the dose uncertainty in S1 was within ± 5.0%, and that in S2 was within ± 3.0%. The LETd change in S1 was within ± 0.3 keV/µm, and that in S2 was within ± 0.2 keV/µm. Biological sample preparation, irradiation, and processing The non-small cell lung cancer cell line H460 was obtained from the American Type Culture Collection and cultured in RPMI 1640 medium with 10% fetal bovine serum and 1% penicillin-streptomycin in a humidified incubator at 37 °C and 5% CO2. Cells were counted with an automated Vi-Cell XR system. For high-throughput clonogenic assays, cells were plated by using a multichannel pipette at 100 cells per well in a total volume of 100 µL. After plating, the 96-well plates were incubated for 1.5 h at room temperature to allow cell attachment and moved to be incubated at 37 °C for 8–10 h before irradiation. One plate was brought into the treatment room for each proton irradiation with its Lucite slab (S1 or S2) and clonogenic-specific index cover and returned to the incubator immediately after exposure. The proton experiments involved irradiation with 0.5 Gy to 6 Gy at 0.5-Gy intervals. For the reference photon experiments, one plate was irradiated per dose level from 1 Gy to 6 Gy at 1-Gy intervals. Control plates were processed identically to the irradiated plates but were not irradiated. A total of 96 samples were analyzed for each dose level. After colonies formed (at 5.5 days for H460 cells), cells were fixed and stained with 0.5% crystal violet in 100% ethanol. A high-content automated laser confocal system (IN Cell Analyzer 6000) was used to identify viable colonies 27 . Only colonies containing 50 or more cells were used for data analysis. The surviving fraction (SF) for each well was analyzed by normalizing the number of counted colonies by the plating efficiency of the control plate. Statistical analyses Statistical analyses were done with GraphPad Prism 9.4.0. SFs after proton and photon irradiation were expressed as mean ± standard error of the mean (SEM). SFs vs. dose were fit by using a weighted (1/Y)-nonlinear regression to the linear-quadratic (LQ) model. The Mann-Whitney test was used to compare SF2 (surviving fraction of cells at 2 Gy) from proton setups S1 and S2. The RBEs from the two proton setups were compared with two-way analysis of variance. Results Proton kinetic energy spectra and LET spectra The proton kinetic energy spectra in experimental setups S1 and S2 at the entrance surface of the cell layer in the 96-well plate are shown in Fig. 4 A. The bin size of the proton energy spectrum was 0.1 MeV. The energy spectrum in S2 is composed of two parts: the low energy ( < ~ 25 MeV) from the 127.4 MeV beam and the high energy ( > ~ 25 MeV) from the 136.4 MeV beam. The corresponding LET spectra are compared in Fig. 4 B. Although the spread of the energy and LET spectra were quite different in S1 and S2, the target LETd values in both were equal to 3.4 keV/µm. The LET spectrum was scored with a bin width of 0.01 in the log10 scale. The ordinate d(LET) stands for the differential dose contribution of the corresponding LET. (This type of curve is called a dose spectrum of LET.) The area under the curve is normalized to be unity. LETd is the mean value of the dose spectrum of LET. The LET spectrum in S2 is composed of two parts: the low LET ( < ~ 2 keV/µm) from the 136.4 MeV beam and the high LET ( > ~ 2 keV/µm) from the 127.4 MeV beam. Fig. 4 (A) Proton energy spectra in experimental setups S1 (blue) and S2 (red). The energy spectrum in S2 is composed of two parts: the low energy ( < ~ 25 MeV) from the 127.4 MeV beam and the high energy ( > ~ 25 MeV) from the 136.4 MeV beam. (B) Proton LET spectra in experimental setups S1 (blue) and S2 (red). The LET spectrum in S2 is composed of two parts: the low LET ( < ~ 2 keV/µm) from the 136.4 MeV beam and the high LET ( > ~ 2 keV/µm) from the 127.4 MeV beam. Discussion The RBE is frequently described as a function of two parameters: absorbed dose and LETd. These metrics have been used as input parameters in some proton phenomenological RBE models. In general, radiation-induced damage increases with the dose delivered, and the relationship between surviving fractions of cells can be described by using an LQ model of dose. However, the relationship between RBE and LETd is controversial, with some considering the relationship to be linear and others non-linear. The phenomenological model developed by McNamara et al. 9 and some earlier models predict a linear relationship 10 , 11 , 12 , 29 . However, the latest version of the local effect model (LEM), used for carbon ion therapy in Europe, predicts non-linear behavior of proton RBE with LETd 13 . The in vitro experimental data from our team and some others support a non-linear relationship 6 , 7 , 8 but are not fully consistent with the predictions of the latest LEM model. LETd has been used to correlate with the experimental RBE from either a pristine Bragg curve 7 or a scanning-beam based SOBP 30 . However, LETd and even LET spectrum cannot meaningfully explain the observed significant difference in biological effect with same LETd but different LET spectra as found in the current study. This dilemma motivated us to thoroughly examine the currently used physical quantities as the basis for RBE determination. The limitations of LET used in phenomenological RBE models mandate applying a mechanistic approach at the cellular and DNA level to determine the RBE of protons, especially protons from IMPT. Many mechanistic RBE models have been developed, intended for heavier ions but which are also applicable for protons. In these models, the underlying interaction mechanisms between ionizing radiation and the target cells, e.g., particle track structures, microdosimetry, and DNA damage and repair, are usually included in the modeling process 31 , 32 . Examples of mechanistic RBE models include the repair-misrepair-fixation (RMF) model 32 , 33 , 34 , the microdosimetric-kinetic model (MKM) 35 , 36 , and the LEM 37 . In the RMF model, the frequency-mean specific energy \(\:{\stackrel{-}{y}}_{F}\) (a microdosimetric quantity) is used as an input parameter for predicting cell survival. In contrast, in the modified MKM model used in Japan, the saturation-corrected dose-mean specific energy \(\:{y}^{*}\) (a microdosimetric quantity) is used as an input parameter for predicting cell survival. A threshold lineal energy \(\:{{y}_{0}=150\:keV/\mu\:m}^{\:}\) is used to calculate \(\:{y}^{*}\)by considering the cell overkill effect. However, the choice of the threshold lineal energy is data driven only without a clear mechanistic foundation. In the LEM I model, the basic assumption is that the biological effect of radiation is determined entirely by the spatial local dose distribution inside the cell nucleus. A radial dose distribution function is applied in the LEM I model for predicting cell survival. A review of these three mechanistic models by Stewart et al. 38 revealed that these models predict contradictory trends of the LQ parameter β vs. LET. One specific concern about the modified MKM model was that β is assumed to be a constant depending on the cell type but is independent of beam quality, which contradicts the findings of most in vitro experiments. Sato and Furusawa refined the modified MKM model by taking into account the stochastic nature of specific energies both in a domain and in a cell nucleus 39 , creating the stochastic microdosimetric kinetic (SMK) model. Inaniwa et al. later modified the SMK model and integrated it into an in-house treatment planning system. That modified SMK model treats both α and β coefficients in the LQ model as variables of saturation-corrected domain-specific energy, and that model can provide better predictions at high-LET and high-dose regions 40 , 41 . In these mechanistic models and their variants, either a mean microdosimetric quantity or a local dose deposition function is used as the beam quality parameter, but no details of the microdosimetric spectrum are incorporated into the cell survival prediction. That said, using a mean quantity of microdosimetry—such as dose-mean lineal energy \(\:{\stackrel{-}{y}}_{D}\)—to indicate RBE of charged particles is also questionable. For example, in our previous study of lung cancer cell irradiation with protons, helium ions, and carbon ions, we found that at approximately the same \(\:{\stackrel{-}{y}}_{D}\) of 19 keV/µm, the RBE (at an SF of 0.1 for H460 cells) was protons (2.10) > helium ions (1.75) > carbon ions (1.60) 42 . The microdosimetric spectra showed that the spread of proton spectrum was the broadest and contained more events with y > 30 keV/µm, further evidence that using a mean physical quantity such as \(\:{\stackrel{-}{y}}_{D}\) cannot accurately indicate the particle RBE. Recently, Cordoni et al. developed a novel extension to the MKM model, namely the generalized stochastic microdosimetric model (GSM2), by including the entire microdosimetric spectrum into the RBE prediction 43 , 44 . In our future work, we will apply the GSM2 model and compare predicted RBE values with our experimental data. In the 1990s, Loncol et al. proposed a microdosimetric biological weighting function 28 to correlate differences in RBE as a function of lineal energy y based on experimental data from high-energy gamma rays, fast neutrons, and fast protons. In this system, the RBE of a beam is the integration of the product of differential dose probability density function d(y) and biological weighting function r(y) over the microdosimetric spectrum. This biological weighting function includes four sections representing the different variation trends of differences in RBE vs. lineal energy y. In the first section, the differential RBE r(y) maintains a constant value of about 0.85 until y reaches 10 keV/µm. Second, beyond 10 keV/µm, the differential RBE increases sharply to its peak value (~ 4.5) until y reaches ~ 70 keV/µm. Third, the differential RBE drops to unity when y reaches ~ 100 keV/µm. In the fourth and final section, the differential RBE keeps dropping below 1.0 when y is between 100 and 1,000 keV/µm. Use of this biological weighting function may explain the cell overkill effect observed for heavier ions such as carbon ions. Recently, Parisi et al. extended the application of a biological weighting function to assess the RBE of V79 cells exposed to protons through U-238 ions 45 . Notably, lineal energy and microdosimetric spectra depend on the site size 46 , 47 . A tissue equivalent proportional counter (TEPC) is the most common equipment to measure microdosimetric spectra. The simulated tissue-equivalent site sizes of a TEPC most often used are 1 or 2-µm diameter but can be down to ~ 300 nm diameter. Specialized detectors can simulate sites as small as 25 nm in diameter 46 , 47 , 48 , 49 . The choice of 2 μm diameter as the site (cell nucleus) size in our current study is consistent with the TEPC simulated site size used by Loncol et al. 28 . Additional studies using other site sizes might show a more direct relationship between microdosimetry and biological effect in different cell lines with different sizes of cell nuclei and even sub-organelle/molecular targets. We are currently developing cell line–specific microdosimetry and biological weighting functions based on the data acquired in our previous work 7 , 30 , 42 . In our current study, when we selected 10 keV/µm as the threshold (as did Loncol et al. 28 ), we could use the difference in dose contribution from events with y > 10 keV/µm (3.3% in proton setup S1 and 8.2% in proton setup S2) to explain the observed difference in biological effect (RBE0.1 = 0.97 ± 0.03 in S1 and 1.16 ± 0.04 in S2). It may seem strange that the value of the biological response r(y) used by Loncol et al. 28 is only 0.85 below 10 keV/µm but this is consistent with the use of Cs-137 gamma rays as the reference radiation. The National Council on Radiation Protection and Measurements (NCRP) Report 181 50 (Simon et al., 2018) points out that RBE of photon and electron radiations decreases with decreasing LET or y. The \(\:{\stackrel{-}{y}}_{D}\:\) of Cs-137 gamma rays is roughly 1 keV/µm and the minimum value for high energy protons is about 0.2 keV/µm which suggests that the RBE of high energy protons, relative to Cs-137 gamma rays, will be substantially less than 1.0. The selection of that biological weighting function was arbitrary. Additional experiments are needed to determine the response function more accurately. The significance of the current study is that it showed that the current practice of using the average quantity dose-averaged LET and mean lineal energy may not sufficiently quantify the biological effects of protons and that a detailed energy deposition spectrum such as the microdosimetric spectrum should be used instead. The broader significance is that the development of novel biologic effect models based on the knowledge gained will facilitate the introduction of biologically optimized IMPT into the clinic, thereby increasing the therapeutic index of proton therapy and benefiting patients worldwide. The biological weighting function that includes differential RBE vs. lineal energy has great potential for correlating the finally expressed RBE from the accumulated biological effects to the spectral distribution of energy deposition event. In addition to the beam qualities of energy/LET/microdosimetric spectra, RBE is also a function of dose 5 , 51 . For either S1 or S2, the RBE value increases with the SF (decreased dose) (see Fig. 6 B). This observation is consistent with the description in the AAPM Task Group Report No. 256 that RBE increases with the decrease of dose 5 . In some literature for proton RBE modeling, the maximum RBE (RBEmax) and the minimum RBE (RBEmin) are evaluated based on the linear-quadratic RBE model parameters α and β 9 , 11 , 52 . RBEmax can be acquired at near zero dose and can be described using the ratio of α parameters at high- and low-LET radiations. RBEmin can be acquired at a very high dose and can be described using the ratio of the square roots of the β parameters at high- and low-LET radiation exposures. Jones et al. 52 investigated the RBE of fast neutrons and their results also had implications for protons and heavier ions. A limitation of the current work is that the impact of time sequencing of spot-scanning techniques on biological effects was not investigated. Two types of spot-scanning techniques: “repainting” and “step-and-shoot,” can be implemented in our proton center. In the “repainting” scan pattern, the beamlet only delivers partial monitor units at a spot location, and then moves to the next spot location until all spot locations are scanned. Only partial dose is delivered in a painting; therefore, multiple repaintings are needed to deliver the desired dose. In contrast, in the “step-and-shoot” scan pattern, all monitors units to a spot location are delivered in a few spills sequentially, and then the beamlet moves to the next spot location for delivery. In cell irradiation experiments, the instantaneous particle fluence and dose rate, and energy/LET/microdosimetric spectra vary with time and location and the variation pattern is strongly dependent on the time sequencing of the spot-scanning pattern. Some experiments have shown evidence that RBE can be influenced by the instantaneous fluence/dose rate 8 , 53 , 54 , 55 . In this reported study, only the “repainting” technique was used, and the impact of instantaneous fluence/dose rate on RBE was not evaluated. The spot locations and the repainting scan pattern for this study are illustrated in Figure S1 in Supplementary Materials. The total monitor units, number of spots, beam delivery time, and average dose rate of the proton experimental setup S1 and S2 are listed in Table S5 in Supplementary Materials. In our future study, we will investigate the impact of time sequencing of scan patterns and instantaneous fluence/dose rate on biological effects. Conclusions In conclusion, we verified experimentally that dose-averaged LET (LETd) or the microdosimetric quantity dose-mean lineal energy (\(\:{\stackrel{-}{y}}_{D}\)) may not be appropriate physical quantities to indicate the biological effect of proton beams, particularly for IMPT, in which the energy deposition spectrum of dose-contributing particles can be quite heterogeneous. We also verified that detailed microdosimetric spectra are useful for interpreting the observed difference in biological effects. However, predicting RBE more accurately with microdosimetric spectra will require a cell line–specific mechanistic model involving the stochastic nature of radiation interactions, and biological responses at different chemical and physical stages in the spatiotemporal dimensions. Data availability Acknowledgements This work was supported by the National Cancer Institute [grants U19 CA021239 and P30 CA016672] and by the Research Seed Funding Initiative Award from the American Association of Physicists in Medicine. The high-throughput screening was supported by the Cancer Prevention and Research Institute of Texas [grants RP150578 and RP200668]. We thank Mr. Paul Wisdom for fabricating the irradiation device. We thank Ms. Christine F. Wogan from Division of Radiation Oncology at The University of Texas MD Anderson Cancer Center for editorial assistance on this report. The authors also acknowledge the Texas Advanced Computing Center at The University of Texas at Austin for providing high-performance computation resources that contributed to the research results reported within this paper. URL: http://www.tacc.utexas.edu. Author information Rights and permissions Open Access This article is licensed under a Creative Commons Attribution-NonCommercial-NoDerivatives 4.0 International License, which permits any non-commercial use, sharing, distribution and reproduction in any medium or format, as long as you give appropriate credit to the original author(s) and the source, provide a link to the Creative Commons licence, and indicate if you modified the licensed material. You do not have permission under this licence to share adapted material derived from this article or parts of it. The images or other third party material in this article are included in the article’s Creative Commons licence, unless indicated otherwise in a credit line to the material. If material is not included in the article’s Creative Commons licence and your intended use is not permitted by statutory regulation or exceeds the permitted use, you will need to obtain permission directly from the copyright holder. To view a copy of this licence, visit http://creativecommons.org/licenses/by-nc-nd/4.0/ .
Monte Carlo Frequently Asked Questions (FAQ)
When was Monte Carlo founded?
Monte Carlo was founded in 2019.
Where is Monte Carlo's headquarters?
Monte Carlo's headquarters is located at 548 Market Street, San Francisco.
What is Monte Carlo's latest funding round?
Monte Carlo's latest funding round is Series D.
How much did Monte Carlo raise?
Monte Carlo raised a total of $236M.
Who are the investors of Monte Carlo?
Investors of Monte Carlo include Accel, Notable Capital, Redpoint Ventures, ICONIQ Growth, Salesforce Ventures and 5 more.
Who are Monte Carlo's competitors?
Competitors of Monte Carlo include Bigeye, Cribl, Timeseer, Soda, Anomalo and 7 more.
What products does Monte Carlo offer?
Monte Carlo's products include Monte Carlo Data Observability Platform.
Who are Monte Carlo's customers?
Customers of Monte Carlo include Fox, Shipt, ShopRunner and Vimeo.
Loading...
Compare Monte Carlo to Competitors

Anomalo provides data quality solutions. It offers a platform that automatically detects and explains issues in enterprise data, providing root cause analysis and data monitoring services. It primarily serves businesses that rely heavily on data for decision-making and product development. It was formerly known as Data Gravity. It was founded in 2018 and is based in Palo Alto, California.
BaseCap is a company focused on data health tracking and problem-solving within the data analysis and management sector. The company offers a platform that validates, automates, and transforms critical business information to ensure data integrity and streamline operations. BaseCap primarily serves industries such as mortgage, insurance, education, aerospace manufacturing, utilities, and financial services. It was founded in 2012 and is based in New York, New York.
Datafold specializes in automated testing solutions for data engineers within the data analytics and quality assurance sectors. The company provides tools for data diffing, column-level lineage, and continuous integration testing to ensure data quality throughout development, deployment, and migration processes. Datafold's solutions are designed to help data teams deploy pipelines with confidence, accelerate development, and maintain high data quality standards. It was founded in 2020 and is based in New York, New York.
Acceldata is a company focused on enterprise data observability within the data management and analytics industry. The company offers a platform that monitors enterprise data systems, ensuring data reliability, optimizing costs, and providing observability for compute and query operations. Acceldata's platform is designed to support data-driven enterprises by providing insights into data pipelines, quality, and performance across cloud, on-premises, and hybrid environments. It was founded in 2018 and is based in Campbell, California.
Ample Insight is a company specializing in data science and AI, offering services across various sectors including technology, healthcare, and consumer goods. The company provides consulting and implementation services in AI and machine learning, data engineering and architecture, as well as ensuring data integrity and governance. Ample Insight serves clients in industries such as healthcare, consumer packaged goods, and e-commerce, among others. It was founded in 2018 and is based in Toronto, Ontario.

Ataccama is a software company that focuses on data quality, master data management, data governance, and big data in the technology industry. The company offers a unified data management platform that helps organizations leverage high-quality data in a secure and governed way, including automated data discovery, data quality checks, monitoring, anomaly detection, and data consolidation. It primarily serves sectors such as banking, insurance, finance, healthcare, retail, government, life sciences, telecom, and transportation. It was founded in 2007 and is based in Toronto, Ontario.
Loading...