
Scale
Founded Year
2016Stage
Series F | AliveTotal Raised
$1.603BValuation
$0000Last Raised
$1B | 6 mos agoRevenue
$0000Mosaic Score The Mosaic Score is an algorithm that measures the overall financial health and market potential of private companies.
+60 points in the past 30 days
About Scale
Scale provides a data engine platform. The platform provides generative artificial intelligence (AI) strategies, including fine-tuning, prompt engineering, security, model safety, model evaluation, and enterprise applications. It serves industries such as retail, electronic commerce, logistics, and more. Scale was formerly known as Scale Labs. It was founded in 2016 and is based in San Francisco, California.
Loading...
Scale's Product Videos

ESPs containing Scale
The ESP matrix leverages data and analyst insight to identify and rank leading companies in a given technology landscape.
The data annotation market provides services for labeling large volumes of data in preparation for training AI and ML models. This market comprises both text and image & video annotation services. Most companies employ human annotators to classify and label datasets, with some offering AI-powered automation tools to speed up the process.
Scale named as Leader among 15 other companies, including Snorkel AI, Labelbox, and TELUS International.
Scale's Products & Differentiators
Scale Rapid
Scale Rapid is self-serve, on-demand labeling to train AI with high quality ground truth data and enables machine learning engineers and researchers to receive high quality labels and instruction feedback in a matter of hours and scale to production volumes in days. With Rapid, customers can create their labeling projects, upload data labeling via UI or API, design and submit their labeling instructions and direct quality improvements with new or updated evaluation tasks. This allows customers to unlock early AI/ML prototyping as well as more insight and control over the labeling workflow, as customers can receive prompt feedback on labeling instructions and potential edge cases for rapid iteration.
Loading...
Research containing Scale
Get data-driven expert analysis from the CB Insights Intelligence Unit.
CB Insights Intelligence Analysts have mentioned Scale in 15 CB Insights research briefs, most recently on Oct 4, 2024.

Oct 4, 2024
The 3 generative AI markets most ripe for exits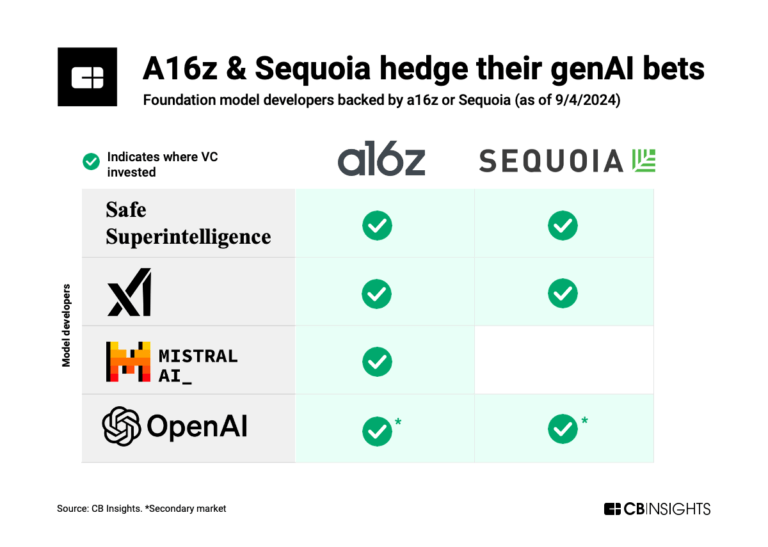
Jul 31, 2024 report
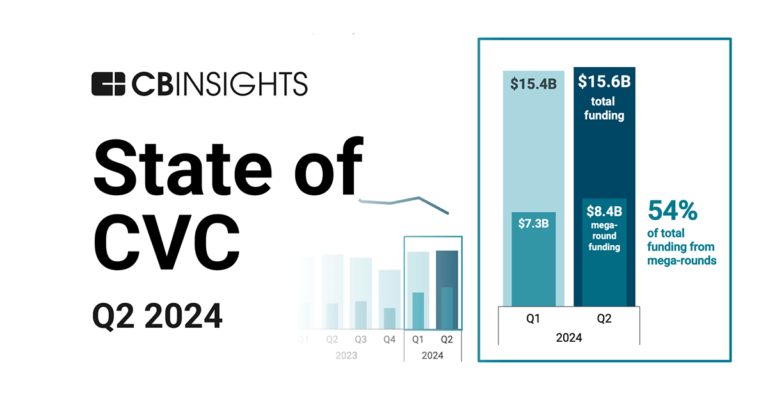
State of CVC Q2’24 Report
Jul 30, 2024 report
State of AI Q2’24 Report
Jul 3, 2024 report
State of Venture Q2’24 Report

Feb 20, 2024
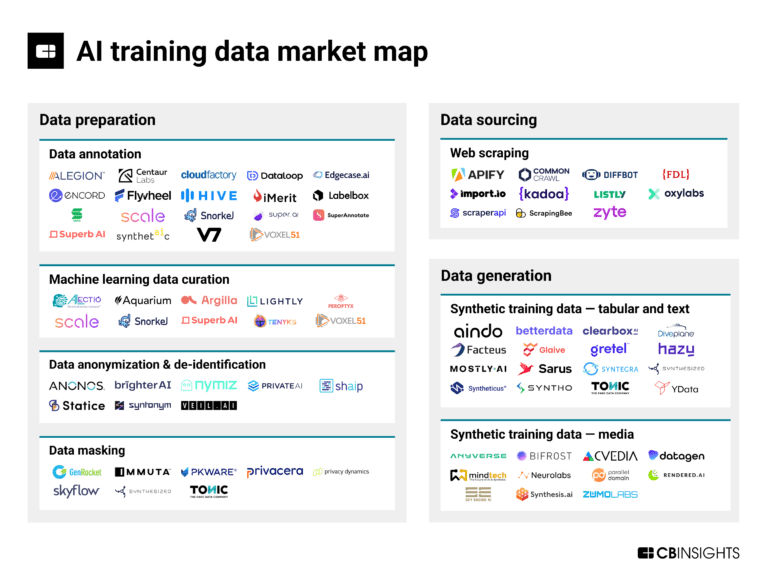
The AI training data market mapExpert Collections containing Scale
Expert Collections are analyst-curated lists that highlight the companies you need to know in the most important technology spaces.
Scale is included in 6 Expert Collections, including Auto Tech.
Auto Tech
2,550 items
Companies working on automotive technology, which includes vehicle connectivity, autonomous driving technology, and electric vehicle technology. This includes EV manufacturers, autonomous driving developers, and companies supporting the rise of the software-defined vehicles.
Unicorns- Billion Dollar Startups
1,249 items
Tech IPO Pipeline
539 items
Track and capture company information and workflow.
AI 100
100 items
Winners of CB Insights' 5th annual AI 100, a list of the 100 most promising private AI companies in the world.
Generative AI
942 items
Companies working on generative AI applications and infrastructure.
Artificial Intelligence
6,888 items
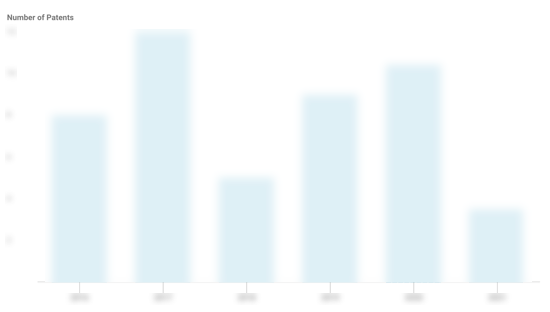
Scale Patents
Scale has filed 17 patents.
The 3 most popular patent topics include:
- artificial neural networks
- artificial intelligence
- computer vision
Application Date | Grant Date | Title | Related Topics | Status |
|---|---|---|---|---|
12/9/2022 | 6/18/2024 | Sensors, Mass spectrometry, Gas sensors, Weighing instruments, Systems engineering | Grant |
Application Date | 12/9/2022 |
|---|---|
Grant Date | 6/18/2024 |
Title | |
Related Topics | Sensors, Mass spectrometry, Gas sensors, Weighing instruments, Systems engineering |
Status | Grant |
Latest Scale News
Nov 4, 2024
- GAPDH: 5ʹ-GCACCGTCAAGGCTGAGAAC-3ʹ and 5ʹ-TGGTGAAGACGCCAGTGGA-3ʹ To quantitatively evaluate relative gene expression, the data were analyzed using the 2−ΔΔCt method. 38 All samples were performed in triplicate, and each experiment was repeated five times. Western Blot Analysis Equal protein samples (20 μg/lane) separated by SDS-PAGE gels were transferred to PVDF membranes (Millipore, Merck, USA). The samples were blocked for 15 minutes at room temperature using a rapid blocking solution (Servicebio, Wuhan, China). After determining the appropriate primary antibody incubation sites based on the molecular weights of COL-1 (Proteintech, Hubei, China), ALP (Proteintech, Hubei, China), RUNX-2 (ImmunoWay, Plano, TX, USA), GAPDH (Proteintech, Hubei, China), ER-α (Abways, Shanghai, China), AKT (Abways, Shanghai, China) and p-AKT (Abways, Shanghai, China), the incubation chamber was maintained at 4°C throughout the night. The membranes were then rinsed three times with Tris-buffered saline containing 0.1% Tween 20 (TBST) (Beyotime, Shanghai, China) for 10 minutes each. The selection of secondary antibodies was based on the species of the primary antibody. After incubation, a chemiluminescent substrate (Yeasen, Shanghai, China) was used with the Chemiluminescence Imaging System (Amersham Imager 600; GE Healthcare, Little Chalfont, UK). Each experiment was repeated five times. Immunofluorescence Assay The treated cells were fixed at 20–25°C for 30 minutes with 4% paraformaldehyde and exposed to 0.1% Triton X-100 (Solarbio, Beijing, China) for 12 minutes. Subsequently, the cells were blocked with 5% bovine serum albumin (BSA-V; Solarbio, Beijing, China) for 1 hour and then exposed to the primary antibody for COL-1 (1:50) at 4°C throughout the night. After removing the primary antibody, the cells were incubated with the fluorescein (FITC)-conjugated affinity pure goat anti-rabbit IgG (H + L) (1:200, SA00013-2) at room temperature for 1 hour in the dark. Subsequently, the cell nuclei were stained with 4,6-diamidino-2-phenylindole (DAPI; Solarbio, Beijing, China). Observation and image capture were employed with a fluorescence microscope (Leica, Wetzlar, Germany). The fluorescence intensity was analyzed using ImageJ software (National Institutes of Health, Bethesda, MD, USA). LY294002 and MPP Treatments LY294002 39 is a broad-spectrum PI3K inhibitor that blocks the PI3K/AKT pathway. The cells were divided into four groups: (1) Control group: Treated with osteogenic induction medium only. (2) LY294002 group: Treated with osteogenic induction medium + 10 μM LY294002 (Soluabio, Shanghai, China). (3) CAT group: Treated with osteogenic induction medium + 10 μM CAT. (4) CAT + LY294002 group: Treated with osteogenic induction medium + 10 μM CAT + 10 μM LY294002. Upon 14 days of induction, ALP staining and Western blot analysis were executed to evaluate the expression of related proteins, whereas ARS was conducted after 28 days of induction. MPP 40 is a selective ER-α inhibitor. The cells were divided into four groups:(1) Control group: Treated with osteogenic induction medium only. (2) MPP group: Treated with osteogenic induction medium + 10 μM MPP (Selleck, Houston, TX, USA). (3) CAT group: Treated with osteogenic induction medium + 10 μM CAT. (4) CAT + MPP group: Treated with osteogenic induction medium + 10 μM CAT + 10 μM MPP. The Western blot analysis assessed the protein expression following 14 days of induction. Establishment of the OTM Model Eighteen male SD rats (7 weeks old, mean weight 180±5 g, procured from Shanghai Model Organisms Ltd.) were maintained in specific pathogen-free (SPF) conditions, with a controlled temperature (20–25°C), humidity (65–70%), and a 12-hour light-dark cycle. The required experimental animal size was calculated according to the resource equation method. 41 Detailed methodology can be found in Supplementary Data 1 . All experiments involving the rats adhered to the National Institutes of Health Guidelines for the Care and Use of Laboratory Animals and were approved by the Institutional Animal Care and Use Committee of Shandong University (No. 20220345). Rats were anesthetized with the inhalational anesthetic isoflurane (Yipin Pharmaceutical Co., Ltd, Hebei, China), followed by an intraperitoneal (IP) administration of pentobarbital sodium (40 mg/kg). The orthodontic device included a nickel-titanium tension spring, stainless steel orthodontic wire (0.20 mm; Aosu, Hangzhou, China), and polymers (Charisma; Heraeus Kulzer, Germany). The right maxillary first molar was connected to the middle incisor tooth by a spring, ensuring the maxillary first molar moved towards the midline with a force of 50 g using an orthodontic dynamometer (XIHUBIOM, Hangzhou, China). After inserting the OTM device into the oral cavities of 18 rats, 9 rats were randomly allocated to the control group, receiving daily injections of an equal volume of physiological saline for the same period. In comparison, the remaining 9 rats were assigned to the CAT group and received CAT with a 10mg/kg/day dosage. Micro-CT The anesthetized rats were injected with 4% paraformaldehyde from the left ventricle for systemic perfusion to fix the maxillary bone tissue, specifically the right maxillary first molars. Subsequently, the samples underwent fixation in a 4% paraformaldehyde solution for 1 day at 4°C. The desiccated specimens were then affixed onto the specimen table and subjected to micro-CT scanning (Quantum GX2, PerkinElmer, USA) at 90 kV, 88 μA, each layer measuring 36 μm in thickness. The scanning region encompassed three right maxillary molars and their contiguous alveolar bone. Each specimen required approximately 15 minutes for the scanning process. Micro-CT imaging data were imported into RadiAnt Viewer software (Medixant, Poznan, Poland) in DICOM format to facilitate 3D reconstruction, with correction of each axis direction. The OTM distance was determined by measuring the shortest interproximal span between the first molar’s distal surface and the second molar’s mesial surface on the right maxillary. 42 The CTAn (CT analysis software; Skyscan NV) was used to compute microstructure parameters of the region of interest (ROI), including bone volume/total volume (BV/TV), trabecular thickness (Tb.Th) and trabecular separation/spacing (Tb.Sp). 43 HE and TRAP Staining The specimens underwent 12 weeks of decalcification in a 10% EDTA solution (pH 7.2). Decalcified specimens were subjected to progressive ethanol dehydration and embedded specimens in paraffin wax. Specimens were cut from proximal to distal direction, and the thickness of each paraffin section was 4 μm. The slides were subjected to HE staining to observe the morphological changes in periodontal tissue. The sections performed TRAP staining with a TRAP staining kit (Solarbio, Beijing, China) to observe TRAP-positive (TRAP+) cells (osteoclasts). 44 TRAP+ cells were counted using ImageJ software. IHC Staining Place the slide in citrate buffer to perform high-temperature antigen retrieval. Subsequently, block non-specific binding sites with 5% goat serum for 40 minutes. Immerse the slide in a solution containing specific primary antibodies such as polyclonal anti-rabbit RUNX2 (1:200; ImmunoWay, Plano, TX, USA), COL-1 (1:300; Proteintech, Hubei, China), and RANKL (1:300; Solarbio, Beijing, China) antibodies and incubate overnight at 4°C. Incubate the biotin-labeled secondary antibody (goat anti-mouse/rabbit IgG) for a minimum of 30 minutes. Upon completion of the washing process, treat the slices using the SP reagent kit (Solarbio, Beijing, China). Following hematoxylin counterstaining, a microscopic examination of the section was performed. Use ImageJ software to determine the average optical density (AOD) value. Data Analysis The group assignments were concealed from the measurement personnel to ensure blinding and consistency, and the same individual conducted five repetitions for all measurements. All analyses were based on five separate experiments. Due to the small sample size per group, bootstrap was employed. The average was considered the final result. The data obtained were represented as mean ± standard deviation (mean ± SD), and one-way or two-way analysis of variance (ANOVA) was conducted using GraphPad Prism software (version 8, MacKiev Software, Boston, MA, USA). The Shapiro–Wilk test was used to evaluate the normality of the data, and the F-test was used to evaluate the homogeneity of the variance. The Tukey’s test was used for post hoc analysis. P < 0.05 was considered statistically significant. Results Culture and Identification of hPDLSCs At approximately 1 week of culture, spindle, and stellate cells were observed migrating out of the tissue block ( Figure 1A ). Individual cells were expanded in vitro for approximately 6 days to form colonies ( Figure 1B ), and by two weeks, the cells were uniform and spindle-shaped ( Figure 1C ). Lipid droplets and calcified nodules were individually observed using Oil Red O staining ( Figure 1D ) and ARS experimentation ( Figure 1E ). These results indicated that hPDLSCs can differentiate in multiple directions. Flow cytometric analysis indicated that the surface markers CD44 and CD105 ( Figure 1H and J ) were expressed by the MSCs associated with hPDLSCs. In contrast, the hematopoietic-related markers CD34 and CD45 ( Figure 1G and I ) exhibited minimal expression levels. It proved that the hPDLSCs are MSCs free from contamination by hematopoietic stem cells or endothelial cells. Figure 1 Cultivation and Characterization of hPDLSCs. (A) Stellate-shaped cells migrated out from tissue blocks. Scale bar: 500 μm. (B) After approximately 6 days, individual hPDLSCs formed colonies. Scale bar: 200 μm. (C) After about 2 weeks, hPDLSCs were arranged in a spiral pattern and exhibited a spindle-shaped morphology. Scale bar: 200 μm. (D) After osteogenic induction, hPDLSCs exhibited dark brown calcified nodules following Alizarin Red staining. Scale bar: 500 μm. (E) After adipogenic induction, hPDLSCs exhibited lipid droplets of different sizes when stained with Oil Red O. Scale bar: 500 μm. (F) The molecular structure of catalpol (CAT; C15H22O10). (G–J) Analysis of hPDLSCs surface marker expression by flow cytometry. The expression of CD34 (G) and CD45 (I) was negative, while CD44 (H) and CD105 (J) were highly expressed. Effect of CAT on Cell Proliferation CCK-8 experiments showed that CAT ( Figure 1F ) at various concentrations (0, 0.1, 1, 10, 50, and 100 μM) had no significant effect on hPDLSCs on the first and third days ( Figure 2 ). However, CAT at these concentrations stimulated the proliferation of hPDLSCs on the fifth day. Notably, CAT at various 1, 10, 50, and 100 μM concentrations significantly promoted cell proliferation (P < 0.0001). Figure 2 Effects of CAT on the proliferation of hPDLSCs. (A and B) CCK-8 analysis for the proliferation of hPDLSCs treated with CAT (0, 0.1, 1, 10, 50, 100 μM) on days 1, 3, and 5. On day 5, 10 μM CAT showed the highest proliferative activity (two-way ANOVA). Error bars stand for mean ± SD. ****P < 0.0001. Each experiment was repeated five times. Effect of CAT on ALP Activity and Calcified Nodules ALP activity assay showed that the ALP activity of hPDLSCs induced with various concentrations of CAT (0.1, 1, 10, 50, 100 μM) was increased relative to the control group (P < 0.0001) ( Figure 3B ). According to the above results, 1, 10, and 100μM CAT were selected as low, medium, and high concentrations for follow-up experiments. ALP staining showed that the plate of 10 μM CAT was dark blue ( Figure 3A ). ARS showed more and darker calcified nodules in the CAT group, and the 10μM CAT group was the most apparent ( Figure 3C ). The calcium quantitative experiment showed the same trend as the alizarin red staining experiment (P < 0.0001) ( Figure 3D ). Figure 3 CAT promoted the osteogenic differentiation of hPDLSCs. (A) ALP staining of the plates with CAT (0, 1, 10, 100 μM). The deepest blue was observed at 10 μM CAT. Scale bar: 200 μm. (B) ALP activity quantification of hPDLSCs stimulated with CAT (0, 0.1, 1, 10, 50, 100 μM) for 14 days. The most significant effects were observed with 1 μM and 10 μM CAT (one-way ANOVA). Error bars stand for mean ± SD. ****P < 0.0001. (C) ARS of hPDLSCs with CAT (0, 1, 10, 100 μM) after 28 days of osteogenic induction. The deepest red was observed at 10 μM CAT with the highest number and darkest color of calcified nodules. Scale bar: 500 μm. (D) Quantitative determination of ARS (one-way ANOVA). Error bars stand for mean ± SD. ****P < 0.0001. (E) Immunofluorescence detection of the expression of COL-1. 10 μM CAT was observed with the strongest immunofluorescence intensity. Scale bar: 100 μm. (F) Quantitative detection of COL-1 immunofluorescence intensity (one-way ANOVA). Error bars stand for mean ± SD. **P < 0.01. Each experiment was repeated five times. Effect of CAT on the Expression Levels of COL-1, ALP, RUNX-2, p-AKT, and ER-α qRT-PCR showed that 1, 10, and 100 μM CAT promoted the expression of osteogenesis-related genes COL-1 ( Figure 4C ), ALP ( Figure 4D ) and RUNX-2 ( Figure 4E ) (P < 0.0001). Western blot assay ( Figure 4A and B ) showed that 1, 10, and 100 μM CAT promoted the expression of proteins related to osteogenesis, including COL-1 ( Figure 4F ), ALP ( Figure 4G ), RUNX-2 ( Figure 4H ), p-AKT ( Figure 4I ) (P < 0.0001) and ER-α (P < 0.001) ( Figure 4J ). The results aligned with the trend observed in qRT-PCR, where 10 μM CAT contributed the most. Based on these experiments, 10 μM CAT was selected as the optimal concentration for immunofluorescence staining ( Figure 3E ). The evidence suggested that 10 μM CAT could stimulate the expression of COL-1, and the fluorescence intensity exhibited a significant increase compared to the control group (P < 0.01) ( Figure 3F ). Figure 4 CAT promotes the expression of osteogenic differentiation markers in hPDLSCs. (A) The protein levels of COL1, ALP, and RUNX2 with CAT (0, 1, 10, 100 μM) after osteogenic induction for 14 days. (B) The protein levels of p-AKT and ER-α with CAT (0, 1, 10, 100 μM) after osteogenic induction for 14 days. (C–E) The mRNA levels of COL1, ALP, and RUNX2 with CAT (0, 1, 10, 100 μM) after osteogenic induction for 14 days (one-way ANOVA). Error bars stand for mean ± SD. ****P < 0.0001. (F–J) Relative quantification of COL1 (F), ALP (G), RUNX2 (H), p-AKT (I), and ER-α (J) protein levels with CAT (0, 1, 10, 100 μM) after osteogenic induction for 14 days (one-way ANOVA). Error bars stand for mean ± SD. ***P < 0.001, ****P < 0.0001. Each experiment was repeated five times. CAT Stimulates Osteogenic Differentiation by Activating the PI3K/AKT Pathway To further investigate the mechanism of CAT on the osteogenic differentiation of hPDLSCs, the cells were exposed to 10 μM CAT with or without LY294002. After the addition of LY294002, ALP activity ( Figure 5B ) was decreased (P < 0.0001), ALP staining ( Figure 5A ) and ARS ( Figure 5C ) became light, and calcium nodules were reduced ( Figure 5D ) (P < 0.0001). Western blot analysis ( Figure 6A and B ) unveiled the levels of expression for p-AKT ( Figure 6F ), and osteogenic-related proteins COL-1 ( Figure 6C ), ALP ( Figure 6D ), and RUNX-2 ( Figure 6E ) were down-regulated (P < 0.01, P < 0.001, P < 0.0001), indicating that the PI3K/Akt pathway was inhibited. The original osteogenic effect was also inhibited. Interestingly, however, the increased expression of ER-α ( Figure 6G ) due to CAT was not reversed. Figure 5 CAT promoted osteogenic differentiation of hPDLSCs through the PI3K/AKT pathway. LY294002 successfully reversed the promotion of ALP activity and calcium nodule formation by CAT. (A) ALP staining images following osteogenic induction for 14 days of the control and CAT groups (10 μM) with or without LY294002 were added. (B) ALP activity quantification of hPDLSCs following osteogenic induction for 14 days of the control and CAT groups (10 μM) with or without LY294002 added (one-way ANOVA). Error bars stand for mean ± SD. ****P < 0.0001. (C) Representative images of ARS after osteogenic induction for 28 days of the control group and CAT group (10 μM) with or without LY294002 added. (D) Quantitative determination of ARS after osteogenic induction for 28 days of the control group and CAT group (10 μM) with or without LY294002 added (one-way ANOVA). Error bars stand for mean ± SD. ****P < 0.0001. Each experiment was repeated five times. Figure 6 CAT promoted osteogenic differentiation of hPDLSCs through the PI3K/AKT pathway. LY294002 successfully reversed the expression of osteogenic differentiation markers by CAT. (A and B) The protein levels of COL1, ALP, RUNX2, p-AKT, and ER-α following osteogenic induction for 14 days of the control group and CAT group (10 μM) with or without LY294002 added. (C–G) Relative quantification of COL1 (C), ALP (D), RUNX2 (E), p-AKT (F), and ER-α (G) protein levels following osteogenic induction for 14 days of the control group and CAT group (10 μM) with or without LY294002 added (one-way ANOVA). Error bars stand for mean ± SD. **P < 0.01, ***P < 0.001, ****P < 0.0001. Each experiment was repeated five times. ER-α Mediates Stimulation of the PI3K/AKT Pathway by CAT Western blot analysis ( Figure 7A and B ) indicated that treatment of hPDLSCs with 10 μM CAT with/without MPP led to a reduction in ER-α expression (P < 0.0001) ( Figure 7G ) upon the addition of MPP. This reduction was accompanied by the down-regulation of p-AKT ( Figure 7F ) and the osteogenesis-associated proteins COL-1 ( Figure 7C ), ALP ( Figure 7D ), and RUNX-2 ( Figure 7E ) (P < 0.01, P < 0.001, P < 0.0001). It demonstrated that both the ER-α and PI3K/AKT pathways were inhibited, with ER-α upstream of the PI3K/AKT pathway, suggesting that ER-α plays an essential role in activating the PI3K/AKT pathway. Figure 7 CAT activated the PI3K/AKT pathway mediated by ER-α to promote the osteogenic differentiation of hPDLSCs. MPP successfully reversed the expression of osteogenic differentiation and pathway-related markers by CAT. (A and B) The protein levels of COL1, ALP, RUNX2, p-AKT, and ER-α following osteogenic induction for 14 days of the control group and CAT group (10 μM) with or without MPP added. (C–G) Relative quantification of COL1 (C), ALP (D), RUNX2 (E), p-AKT (F), and ER-α (G) protein levels following osteogenic induction for 14 days of the control group and CAT group (10 μM) with or without MPP added (one-way ANOVA). Error bars stand for mean ± SD. **P < 0.01, ***P < 0.001, ****P < 0.0001. Each experiment was repeated five times. OTM Model and Micro-CT Analysis The OTM model was established in rats, as shown in Figure 8A . During the experiment, the rats were in good health, and the CAT group showed no significant weight changes compared to the control group ( Figure 8B ), as elaborated in Supplementary Table 1 . The right maxillary first molar was moved mesially after 50 g traction for 14 days, and the movement distance ( Figure 8C and D ) was reduced in the CAT group (10 mg/kg/day CAT) compared to the control group (saline) (P < 0.05). The data on each rat’s tooth travel distance is shown in Supplementary Table 2 . During the same period, a decrease in the speed of OTM was observed in the CAT group. On the tension side of the distal mesial buccal root of the first molar, BV/TV, Tb.Sp and Tb.Th showed an increase in the CAT group relative to the control group (P < 0.05, P < 0.01). On the pressure side, BV/TV, Tb.Sp and Tb.Th also experienced a minor increase in the CAT group; however, the disparity lacked statistical significance ( Figure 8E–H ). Figure 8 The establishment of the orthodontic tooth movement model and three-dimensional reconstruction analysis of sample data. (A) Orthodontic tooth movement model in rats. (B) Weight changes of rats in the control and 10mg/kg/day CAT groups at day 14 (one-way ANOVA). Error bars stand for mean ± SD (n=9). (C) Measurement of the mesial movement distance of the first molar on the right maxillary. Illustration of the comparison between the control (a) and 10mg/kg/day CAT (b) groups in measuring the mesial movement distance of the first molar on the right maxillary. Abbreviations: 1st, first molar; 2nd, second molar. (D) Quantitative analysis of the mesial displacement of the first molar on the right maxillary in the control group and 10mg/kg/day CAT group (one-way ANOVA). Error bars stand for mean ± SD (n=9). *P < 0.05. (E) Region of interest (ROI) of bone analysis marked with a white box. a, vertical view; b, horizontal view. Abbreviations: 1st, first molar; 2nd, second molar. (F–H) Evaluation of trabecular bone on day 14. Bone volume/total volume (BV/TV), trabecular thickness (Tb.Th), and trabecular separation (Tb.Sp) of the control group and 10mg/kg/day CAT group on the compression side and tension side (one-way ANOVA). Error bars stand for mean ± SD (n=9). *P < 0.05, **P < 0.01. HE and TRAP Staining Observation HE staining ( Figure 9A ) showed that the PDL of the maxillary first molar became narrower on the pressure side, while the PDL became wider on the tension side, and the cells exhibited a long spindle shape. The cellular arrangement of the control group was disturbed, whereas the cells of the CAT group were arranged in a relatively continuous and dense pattern. TRAP staining ( Figure 9B ) revealed positive multinucleated cells (osteoclasts) distributed on the tooth root and alveolar bone surface, with bone resorption pits surrounding the cells. Compared to the control group, the number of osteoclasts ( Figure 9C ) on the compressive side of the root in the CAT group decreased (P < 0.05). Figure 9 Results of HE, TRAP, and IHC staining. Abbreviations: AB, alveolar bone; PDL, periodontal ligament; R, root. (A) HE staining on the compression side of periodontal tissue in both the control group (a) and 10 mg/kg/day CAT group (b) and on the tension side of periodontal tissue in both the control group (c) and 10 mg/kg/day CAT group (d). Scale bar: 50 μm. (B) TRAP staining on the compression side of periodontal tissue in both the control group (a) and 10 mg/kg/day CAT group (b). TRAP-positive cells were marked by black arrows. Scale bar: 50 μm. (C) The number of TRAP-positive cells in the 10 mg/kg/day CAT group (a) decreased relative to the control group (b) (one-way ANOVA). Error bars stand for mean ± SD (n=9). *P < 0.05. (D–I) The immunoreactivity of COL-1 (D), RUNX-2 (F), and RANKL (H) in the control group (a) and 10 mg/kg/day CAT group (b) was detected after 14-day OTM, and their AOD values (E, G and I) were measured (one-way ANOVA). The expression of COL-1 (D) and RUNX-2 (F) could be observed on the tension side, while RANKL (H) was mainly expressed on the compression side. Scale bar: 20 μm. Error bars stand for mean ± SD (n=9). *P < 0.05, **P < 0.01. IHC Staining Analysis IHC staining ( Figure 9D–I ) was conducted to assess the immunoreactivity of COL-1, RUNX-2, and RANKL in the PDL. In the CAT group, compared to the control group, COL-1, and RUNX-2 expression increased on the tension side (P < 0.05, P < 0.01), while RANKL expression decreased on the pressure side (P < 0.05). Discussion hPDLSCs are regarded as the primary and reliable cells for periodontal tissue regeneration, forming the foundation for filling periodontal tissue defects through cell and gene therapy. 45 , 46 Among the available stem cells, hPDLSCs are easily obtained and less invasive to the donor. 17 This investigation achieved the successful isolation and cultivation of hPDLSCs. Flow cytometry analysis confirmed that hPDLSCs are ectomesenchymal stem cells, free from contamination by hematopoietic stem cells and endothelial cells. In vitro induction of hPDLSCs resulted in lipid droplets and calcified nodules forming, demonstrating their multi-directional differentiation capacity. Studies have shown that hUCMSC-exosomes activated the PI3K/AKT pathway to facilitate osteogenic differentiation in hPDLSCs under hyperglycemic conditions. 47 Han et al revealed that Ipriflavone stimulates osteogenic differentiation of hPDLSCs through the GPR30/PI3K/AKT pathway. 48 hPDLSCs represent a real potential for regenerating periodontal tissues, both for the orthodontic treatment of patients with periodontitis and for the retention phase after OTM. Estrogen stimulates osteogenic differentiation of hPDLSCs, inhibits osteoclastic differentiation, promotes apoptosis, and regulates periodontal tissue remodeling in OTM. 30 Phytoestrogens, such as CAT, have minimal adverse reactions, in contrast to the rare but significant side effects associated with estrogen use for preventing osteoporosis in postmenopausal women, which include jawbone necrosis, atypical fractures, breast cancer, and thromboembolism. 49 , 50 On January 25, 2017, “Catalpol Tablet”, 21 a traditional Chinese medicinal product, received clinical research approval from the State Food and Drug Administration (SFDA). Following systematic pharmacological mechanism and pharmacokinetics studies, CAT has been identified as a compound of significant medicinal value. CAT was found to promote osteogenic-angiogenic coupling and was validated in a rat model of cranial bone defects in osteoporosis. 51 Additionally, CAT ameliorates dexamethasone-induced osteoporosis by promoting osteogenic differentiation of BMSCs by activating the PKD1 promoter. 26 Therefore, CAT has excellent biological safety as a phytoestrogen involved in bone metabolism. hPDLSCs increased levels of osteogenesis-related gene expression, such as COL-1, ALP and RUNX-2, at 14 and 21 days in an osteogenic medium. 52 In the present study, the upregulation of COL-1, ALP, and RUNX-2 expression was significant at 14 days of osteogenic induction in hPDLSCs, consistent with the above results. ALP 53 is one of the earliest functional genes in the calcification mechanism and a marker of osteoblast maturation. The 10 μM CAT group exhibited the highest ALP activity and darkest blue ALP staining. COL-1 serves as an indicator for osteogenesis and collagen formation. Mutations in the COL-1 gene can lead to osteogenesis imperfecta (OI). 54 Immunofluorescence assay of COL-1 in the 10 μM CAT group revealed a significant enhancement of fluorescence intensity. RUNX-2 55 is an essential osteogenesis marker activating the osteoblast differentiation gene. RUNX-2 regulates ALP and COL-1 by binding to cis-acting elements (OSE2 in the OC promoter region), a mechanism that emphasizes the importance of RUNX-2 in studying skeletal development. 56 The occurrence of calcium nodules is a manifestation of osteogenic differentiation and maturation, reflecting the ability of late osteogenic differentiation. The results of these osteogenesis-related metrics indicated that appropriate concentrations of CAT promoted the osteogenic differentiation of hPDLSCs, with 10 μM of CAT achieving the maximum stimulation response. This finding is consistent with previous reports 57 that hPDLSCs have a hormone dose response similar to stem cells. The PI3K/AKT pathway significantly regulates osteoblast and osteoclast function by affecting their formation, proliferation, differentiation, and apoptosis. 58 AKT activation is highly correlated with osteogenesis, as evidenced by an increase in osteogenic markers, including COL-1 and RUNX-2, which trigger the maturation of stem cells into functional osteoblasts. 36 RUNX-2 and the PI3K/AKT/mTOR pathways form a feedback loop that positively regulates the differentiation of osteoblasts. 59 It has been demonstrated that AKT activity is required at all stages of osteoblast differentiation and function, and the PI3K/AKT pathway represents a crucial element within the intricate osteogenic pathway network. 60 Previous studies 28 have found that CAT exerts antidiabetic, cardioprotective, vasoprotective, and antitumor effects closely related to the PI3K/AKT pathway. LY294002 61 is a potent inhibitor of PI3K/AKT, which reduces the expression of phosphorylated AKT (Ser473). In this study, LY294002 successfully inhibited the PI3K/AKT pathway, leading to the reversal of the estrogen-like effect produced by CAT on hPDLSCs. The decrease in ALP activity, lightening of ALP staining, reduction in calcium nodules, and decreased expression of relevant osteogenic markers all indicate that CAT stimulates the osteogenic differentiation of hPDLSCs by triggering the PI3K/AKT pathway. Studies 62 , 63 have suggested the involvement of both ER-α and ER-β of hPDLSCs in osteogenic differentiation. Given this perspective, we selectively inhibited ER-α in hPDLSCs using MPP, which reduced the expression of ER-α, p-AKT, and related osteogenic markers. It indicates that not only do hPDLSCs express ER-α, but ER-α also regulates the osteogenic differentiation process of hPDLSCs by mediating the PI3K/AKT pathway. Wu et al 64 suggested that the phytoestrogen Genistein could improve bone healing by triggering ER-α-mediated expression of osteogenesis-related genes and subsequent osteoblast maturation. Additionally, mechanical forces can activate ER-α in hPDLSCs and affect osteogenesis and differentiation of osteoblasts; 30 therefore, activation of ER-α is essential in regulating OTM and relapse. Furthermore, it was found that regulation of ER-α expression in osteoclast precursor cells induced osteoclast apoptosis and reduced osteoclast activity and proliferation. 65 This demonstrates that ER-α is an essential regulator of bone homeostasis. This investigation focused on exploring the impact of CAT on periodontal tissue remodeling in vivo by establishing an animal model. 42 , 43 Micro-CT analysis showed that BV/TV, Tb.Sp and Tb.Th increased on the tension side, suggesting that CAT can enhance osteogenic differentiation compared to the control group. IHC staining for COL-1 and RUNX-2 also confirmed that CAT may promote osteogenic differentiation on the tension side. No significant statistical variances were noted in BV/TV, Tb.Sp and Tb.Th when compared with the control group. However, these parameters were elevated on the compression side. TRAP staining experiments demonstrated a reduction in osteoclasts on the pressure side in the CAT group compared with the control group. Thus, we inferred that CAT inhibited osteoclastic activity on the pressure side. Activating RANKL/RANK signaling stimulates osteoclast formation and differentiation, promoting bone resorption. 66 Previous research 67 has indicated that CAT suppresses osteoclastogenesis by inhibiting RANKL and the expression of osteoclast-specific genes. CAT promotes osteoclast apoptosis through the Sirt6-ER-α-FasL axis to alleviate osteoporosis in ovariectomized rats. 32 In this study, the expression of RANKL on the root pressure side of rats in the CAT group was decreased, indicating that CAT was implicated in the modulation of osteoclasts during bone remodeling, which was the same as the results of previous studies. 68 Under mechanical forces within the biological system, bone resorption occurs on the compressed side, while osteogenesis occurs on the tension side, achieving a dynamic equilibrium and enabling OTM. In vivo experiments demonstrated that CAT promotes osteogenic differentiation of periodontal tissues on the tension side and suppresses bone resorption on the compression side, ultimately reducing tooth movement distance. This provides a reference for post-orthodontic retention, tooth relapse, and displacement prevention. Based on the above-discussed findings, we propose that 10 μM CAT effectively promotes the proliferation and osteogenic differentiation of human periodontal ligament stem cells (hPDLSCs) via the ER-α-mediated activation of the PI3K/Akt pathway. Furthermore, the administration of 10 mg/kg/day CAT exhibited significant effects on the tension side of the moving root by promoting osteogenic differentiation and simultaneously inhibiting bone resorption on the compression side, thereby positively preventing relapse after orthodontic tooth movement (OTM). Consequently, CAT holds great potential as a natural therapeutic agent for periodontal tissue regeneration and for delaying relapse after OTM. In the context of the existing literature, our findings align with previous studies that emphasize the significance of the PI3K/Akt pathway in osteogenic differentiation and periodontal regeneration. For instance, recent research 47 , 48 has demonstrated that activating this pathway can enhance the regenerative capacity of various stem cells in different scenarios, supporting the notion that CAT’s mechanism of action is consistent with broader evidence in regenerative medicine. Moreover, exploring the potential synergistic effects of CAT in combination with other adjunctive treatments, such as ozone therapy, 69 photobiomodulation, 70 and para probiotics, 71 would be of considerable value. Understanding these interactions could offer insights into optimizing periodontal treatment protocols and improving clinical outcomes. However, we must admit certain limitations in our study. The results obtained from rat models might only partially apply to human applications due to differences in bone structure, drug dosage, force magnitude, and treatment duration. Additionally, the long-term effects of CAT on periodontal tissues and the potential side effects remain ambiguous, requiring further investigation. Future research should address these gaps, particularly regarding the specific dosage and treatment regimens that apply to human patients. Furthermore, the mechanisms by which CAT regulates osteoclast activity and its broader implications in bone remodeling need to be clarified. Investigating these aspects will be crucial for understanding the full therapeutic potential of CAT in periodontal therapy. Conclusion We demonstrated that catalpol promoted hPDLSCs proliferation and osteogenic differentiation in vitro through the ER-α/PI3K/AKT pathway and enhanced periodontal tissue remodeling in vivo using OTM models. Our research may serve as an experimental paradigm for the appropriate clinical utilization of catalpol to slow down relapse after OTM. Abbreviations CAT, catalpol; hPDLSCs, human periodontal ligament stem cells; OTM, orthodontic tooth movement; CCK-8, Cell-counting Kit-8; ARS, Alizarin Red Staining; ALP, alkaline phosphatase; COL-1, collagen type 1; RUNX-2, runx family transcription factor 2; qRT-PCR, quantitative reverse transcription polymerase chain reaction; ER-α, receptor-α; PI3K/AKT, phosphatidylinositol-3-kinase-protein kinase B; MPP, methyl-piperidine-pyrazole; p-AKT, phosphoprotein kinase B; micro-CT, Micro-computed tomography; HE, hematoxylin and eosin; TRAP, tartaric-resistant acid phosphatase; RANKL, nuclear factor-κB (NF-κB) ligand; IHC, immunohistochemical; PDL, periodontal ligament; MSCs, mesenchymal stromal cells; RR, Rehmanniae radix Praeparata; ER-β, receptor-β; MAPK, Mitogen-Activated protein kinases; α-MEM, α-minimum essential medium; PBS, phosphate-buffered saline; FBS, fetal bovine serum; OD, optical density; CPC, cetylpyridinium chloride; BCA, bicinchoninic acid; GAPDH, glyceraldehyde-3-phosphate dehydrogenase; AOD, average optical density; TBST, Tris-buffered saline containing 0.1% Tween 20; BSA, bovine serum albumin; DAPI, 4,6-diamidino-2-phenylindole; SD, Sprague-Dawley; SPF, specific pathogen-free; ROI, region of interest; BV/TV, bone volume/total volume; Tb.Th, trabecular thickness; Tb.Sp, trabecular separation/spacing; EDTA, Ethylenediaminetetraacetic acid; ANOVA, analysis of variance; hUCMSC, human umbilical cord mesenchymal stem cell; SFDA, State Food, and Drug Administration; OI, osteogenesis imperfecta; Sirt6, Sirtuin 6; FasL, FasrymndritFas Ligand. Acknowledgments Disclosure References 1. Li XT, Tang Y, Huang XL, et al. Factors influencing subjective orthodontic treatment need and culture‐related differences among Chinese natives and foreign inhabitants. Int J Oral Sci. 2010;2(3):149–157. doi:10.4248/IJOS10050 2. Li Y, Zhan Q, Bao M, et al. Biomechanical and biological responses of periodontium in orthodontic tooth movement: up-date in a new decade. Int J Oral Sci. 2021;13(1):20. doi:10.1038/s41368-021-00125-5 3. Asiry MA. Biological aspects of orthodontic tooth movement: a review of literature. Saudi J Biol Sci. 2018;25(6):1027–1032. doi:10.1016/j.sjbs.2018.03.008 4. Maltha JC, Kuijpers-Jagtman AM. Mechanobiology of orthodontic tooth movement: an update. J World Fed Orthod. 2023;12(4):156–160. doi:10.1016/j.ejwf.2023.05.001 5. Li Y, Jacox LA, Little SH, et al. Orthodontic tooth movement: the biology and clinical implications. Kaohsiung J Med Sci. 2018;34(4):207–214. doi:10.1016/j.kjms.2018.01.007 6. Seddiqi H, Klein-Nulend J, Jin J. Osteocyte mechanotransduction in orthodontic tooth movement. Curr Osteoporosis Rep. 2023;21(6):731–742. doi:10.1007/s11914-023-00826-2 7. Littlewood S, Kandasamy S, Huang G. Retention and relapse in clinical practice. Aust Dent J. 2017;62(S1):51–57. 8. Shanshan R, Xin D, Ming Y, et al. Factors affecting stability after fixed orthodontic treatment. Chin J Stomatol. 2018;53(9):599–603. doi:10.3760/cma.j.issn.1002-0098.2018.09.006 9. Maltha JC, Kuijpers-Jagtman AM, Von den Hoff JW, et al. Relapse revisited-animal studies and its translational application to the orthodontic office. Semin Orthod. 2017;23(4):390–398. doi:10.1053/j.sodo.2017.07.009 10. Franzen TJ, Monjo M, Rubert M, et al. Expression of bone markers and micro-CT analysis of alveolar bone during orthodontic relapse. Orthod Craniofac Res. 2014;17(4):249–258. doi:10.1111/ocr.12050 11. Rosyida NF, Ana ID, Alhasyimi AA. The use of polymers to enhance post-orthodontic tooth stability. Review. Polymers. 2023;15(1): 14.103
Scale Frequently Asked Questions (FAQ)
When was Scale founded?
Scale was founded in 2016.
Where is Scale's headquarters?
Scale's headquarters is located at 303 2nd Street, San Francisco.
What is Scale's latest funding round?
Scale's latest funding round is Series F.
How much did Scale raise?
Scale raised a total of $1.603B.
Who are the investors of Scale?
Investors of Scale include Y Combinator, Accel, Index Ventures, Tiger Global Management, Coatue and 32 more.
Who are Scale's competitors?
Competitors of Scale include Ydata, Encord, Voxel51, Snorkel AI, Chalk and 7 more.
What products does Scale offer?
Scale's products include Scale Rapid and 4 more.
Who are Scale's customers?
Customers of Scale include Brex, iRobot, Flexport, Toyota Research Institute (TRI) and U.S. Air Force.
Loading...
Compare Scale to Competitors

Labelbox develops a training data platform for machine learning teams to build real-world artificial intelligence (AI) solutions. The platform consists of label editor tools for batch and real-time labeling workflows, collaboration, quality review, analytics, and more. It serves the government, retail, insurance, manufacturing, and healthcare sectors. It was founded in 2018 and is located in San Francisco, California.

Defined.ai provides a range of pre-collected and structured training datasets, including text, voice, and image data, and hosts an online marketplace where these datasets can be bought, sold, or commissioned. Defined.ai caters to the AI development sector, providing data that aids in the creation of fair, accessible, and ethical AI solutions. The company was founded in 2015 and is based in Seattle, Washington.

24x7offshoring specializes in data collection, data annotation, and localization services for various industries. The company offers a platform for artificial intelligence (AI) and machine learning data collection, data labeling, and outsourced services, as well as iterative AI training models. It caters to sectors such as science, technology, education, medical research, and public service. The company was founded in 2020 and is based in New Delhi, India.

Snorkel AI specializes in data-centric artificial intelligence solutions for the enterprise domain. The company offers an AI data development platform that enables the development of AI applications by programmatically labeling and curating data, fine-tuning large language models, and building specialized AI models. It primarily serves sectors such as banking, healthcare, government, insurance, and telecom with its AI technology. The company was founded in 2019 and is based in Redwood City, California.

Alegion is a company that focuses on data annotation and collection services, operating within the artificial intelligence and machine learning industry. The company offers services such as data collection, data annotation, and quality control, aimed at transforming unstructured data into high-quality, model-ready training data. Alegion primarily serves sectors such as healthcare, hospitality, insurance, manufacturing, retail, security, software, and sports. It was founded in 2012 and is based in Austin, Texas.

Hive is a leading provider of cloud-based AI solutions in the fields of content understanding, search, and generation. The company offers a suite of pre-trained AI models and turnkey software for tasks such as content moderation, brand protection, and data labeling. Hive's technology is widely used in platform integrity, sponsorship measurement, and context-based advertising among other applications. It was founded in 2013 and is based in San Francisco, California.
Loading...