
SEON Technologies
Founded Year
2017Stage
Incubator/Accelerator - II | AliveTotal Raised
$106.62MRevenue
$0000Mosaic Score The Mosaic Score is an algorithm that measures the overall financial health and market potential of private companies.
-15 points in the past 30 days
About SEON Technologies
SEON Technologies specializes in fraud prevention and risk management within various business sectors. The company offers a suite of tools designed to help businesses detect and prevent fraudulent activities, leveraging technologies such as machine learning, device fingerprinting, and real-time data analysis. It primarily serves sectors such as banking, insurance, eCommerce, online lending, and the gambling industry. It was founded in 2017 and is based in Budapest, Hungary.
Loading...
SEON Technologies's Product Videos

_thumbnail.png?w=3840)
ESPs containing SEON Technologies
The ESP matrix leverages data and analyst insight to identify and rank leading companies in a given technology landscape.
The payments fraud detection & prevention market offers a range of technologies helping businesses detect and block anomalous payment activity. Vendors in this market cater to many different industries, from financial services to e-commerce. These solutions cover a range of different types of financial fraud like chargebacks, ACH, wire, and credit card fraud.
SEON Technologies named as Challenger among 15 other companies, including Mastercard, Oracle, and Fiserv.
SEON Technologies's Products & Differentiators
Intelligence Tool
Immediate enrichment of the most basic data points that a merchant will collect in their customer’s digital interaction - a user’s email, IP (internet protocol) and phone number. Real-time checks of their digital footprint via the most popular 35+ social media sites, online platforms & messengers to help verify their identity with in-depth metadata including data breaches, type of domain, risky ports, geolocation mismatches and more to support.
Loading...
Research containing SEON Technologies
Get data-driven expert analysis from the CB Insights Intelligence Unit.
CB Insights Intelligence Analysts have mentioned SEON Technologies in 6 CB Insights research briefs, most recently on Mar 14, 2024.
Mar 14, 2024
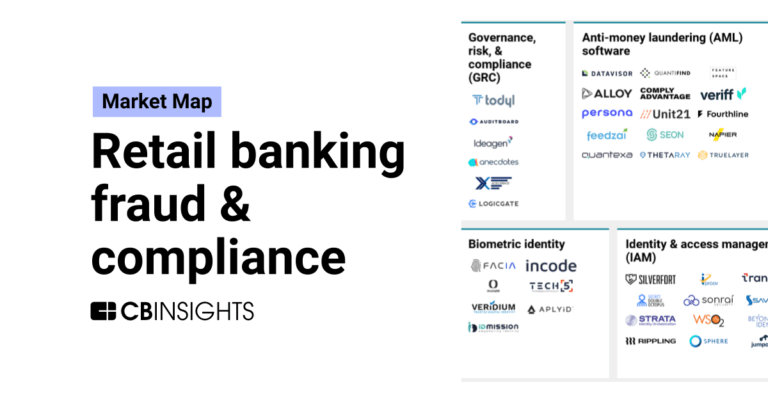
The retail banking fraud & compliance market map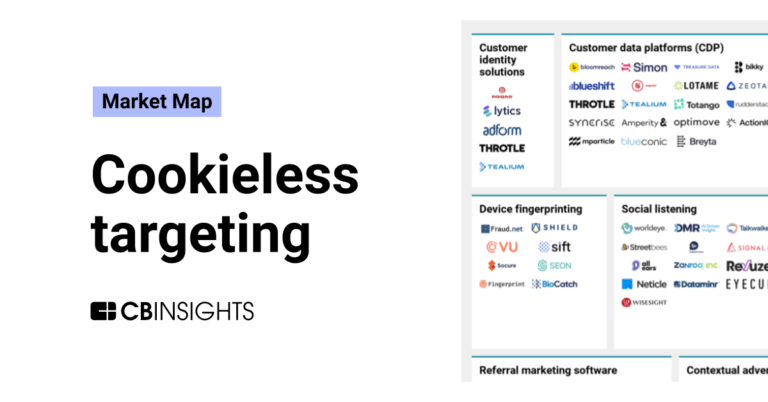
Aug 14, 2023
The cookieless targeting market map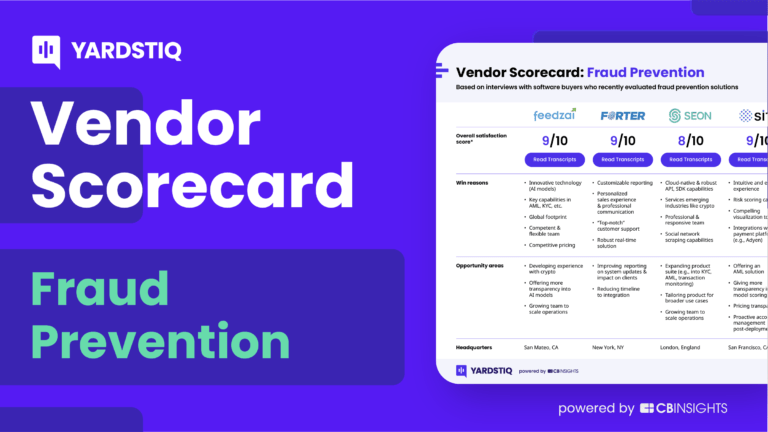
Feb 27, 2023 report
Top fraud prevention companies — and why customers chose them

Expert Collections containing SEON Technologies
Expert Collections are analyst-curated lists that highlight the companies you need to know in the most important technology spaces.
SEON Technologies is included in 6 Expert Collections, including Regtech.
Regtech
1,721 items
Technology that addresses regulatory challenges and facilitates the delivery of compliance requirements. Regulatory technology helps companies and regulators address challenges ranging from compliance (e.g. AML/KYC) automation and improved risk management.
Digital Lending
2,374 items
This collection contains companies that provide alternative means for obtaining a loan for personal or business use and companies that provide software to lenders for the application, underwriting, funding or loan collection process.
Artificial Intelligence
9,055 items
Companies developing artificial intelligence solutions, including cross-industry applications, industry-specific products, and AI infrastructure solutions.
Cybersecurity
9,885 items
These companies protect organizations from digital threats.
Fintech
13,413 items
Excludes US-based companies
Defense Tech
1,270 items
Defense tech is a broad field that encompasses everything from weapons systems and equipment to geospatial intelligence and robotics. Company categorization is not mutually exclusive.
Latest SEON Technologies News
Aug 10, 2023
News provided by Share this article Share toX NEW YORK, Aug. 10, 2023 /PRNewswire/ -- The Fraud Detection and Prevention Market is estimated to grow by USD 47,399.03 million during 2022-2027, growing at a CAGR of 20.22%. North America will contribute 39% to the growth of the global market during the forecast period. There are several leading vendors providing fraud detection and prevention solutions and services in the US. The vendors include IBM, Intel, Symantec, Akamai Technologies, Check Point Software Technologies, and Cisco Systems. Furthermore, there is an increasing threat of cyber threats in North America due to the technological advances in terms of data use and sharing and the deployment of cloud-based systems for storage. Such factors boost the regional market growth during the forecast period. For Comprehensive details on the market size of the historic period(2017 to 2021) and the forecast period (2023-2027) - View Sample report Company Landscape The fraud detection and prevention market is fragmented; the vendors are competing with competitors and are trying to get a greater market share. The market is growing, and the chances of new entrants cannot be overlooked. The major vendors have well-established economies of scale and market presence and generally rely on positioning technological advances, and the price of the products -The report provides a full list of key vendors, their strategies, and the latest developments. Buy Now Market Dynamics Major Drivers & Challenges- The growing adoption of cloud-based services drives the fraud detection and prevention market. Owing to its increasing applications such as authentication processes, video management, biometric information storage, and big data computing, the adoption of cloud-based services across agencies is growing. Flexibility and scalability are some of the main reasons for this because they help organizations in meeting their varying requirements. Furthermore, there is increasing adoption of cloud-based services as several defense agencies do not have their own security infrastructure. Hence, such factors drive the fraud detection and prevention market during the forecast period. The complex IT infrastructure challenges the growth of the fraud detection and prevention market. Although the IoT has high scope for growth and acceptance as it enhances the connectivity among devices and facilitates machine-to-machine (M2M) communication, the implementation of IoT has resulted in a complex IT infrastructure. Organizations are finding it hard to provide maximum security and service to their businesses. This is because it is difficult to identify legitimate end-user devices to connect and exchange data in such a complex network. Hence, such factors can pose a significant threat to the fraud detection and prevention market growth during the forecast period. Key Trends- The technological advancement in fraud detection and prevention solutions and services is an emerging market trend. Generally, technological advancement mainly involves the discovery of knowledge, which advances the understanding of technology. In October 2022, DG Financial Technology Inc, a service provider company in Japan, partnered with Scudetto Corporation, a Japan-based company specializing in online fraud prevention, and launched an artificial intelligence (AI) built fraud detection solution named Sift Digital Trust & Safety Suite (Sift). It is a fraud detection and prevention solution that uses artificial intelligence to detect fraud and abuse in the e-commerce space. Hence, trends like technological advancements can significantly drive the fraud detection and prevention market growth during the forecast period. Company Profiles The fraud detection and prevention market report includes information on the product launches, sustainability, and prospects of leading vendors including ACI Worldwide Inc., BAE Systems Plc, Besedo Ltd., Consultadoria e Inovacao Tecnologica S.A., Dell Technologies Inc., Equifax Inc., Experian Plc, Fair Isaac Corp., Fiserv Inc., Forter Ltd., Global Payments Inc., International Business Machines Corp., NICE Ltd., Oracle Corp., RELX Plc, SAP SE, SAS Institute Inc., SEON Technologies Kft., Software AG, and Visa Inc. Competitive Analysis The report includes competitive analysis, a proprietary tool to analyze and evaluate the position of companies based on their industry position score and market performance score. The competitive scenario categorizes companies based on various performance indicators. Some of the factors considered include the financial performance of companies over the past few years, growth strategies, product innovations, new product launches, investments, and growth in market share, among others. Market Segmentation This fraud detection and prevention market report extensively covers market segmentation by component (solutions and services), end-user (large enterprise and SMEs), and geography (North America, Europe, APAC, South America, and Middle East and Africa). The solutions segment will be significant during the forecast period. The growth of the segment can be attributed to factors such as the growing incidences of intrusion, the requirement for fraud detection and prevention, and infringement. Furthermore, Biometrics authentication was one of the major revenue contributors in the solutions segment. Additionally. the rise in terror threats, increased security project initiatives, and the development of national ID cards are fuelling the market growth of this segment. Hence, such factors drive the solutions segment of the fraud detection and prevention market during the forecast period. Gain instant access to 17,000+ market research reports. Related Reports: The anomaly detection market size is expected to increase by USD 4.23 billion from 2021 to 2026, and the market's growth momentum will accelerate at a CAGR of 15.08%. Furthermore, this report extensively covers the anomaly detection market segmentation by deployment (cloud and on-premise) and geography (North America, Europe, APAC, South America, and the Middle East and Africa). Anomaly detection tools are gaining traction in the BFSI sector, which is driving the anomaly detection market growth. The healthcare fraud detection market size is expected to increase by USD 1.26 billion from 2021 to 2026, and the market's growth momentum will accelerate at a CAGR of 14.26%. Furthermore, this report extensively covers healthcare fraud detection market segmentation by type (descriptive analytics, predictive analytics, and prescriptive analytics) and geography (North America, Europe, Asia, and ROW). The increased number of patients seeking health insurance is notably driving the healthcare fraud detection market growth. Fraud Detection And Prevention Market Scope Report Coverage Key companies profiled ACI Worldwide Inc., BAE Systems Plc, Besedo Ltd., Consultadoria e Inovacao Tecnologica S.A., Dell Technologies Inc., Equifax Inc., Experian Plc, Fair Isaac Corp., Fiserv Inc., Forter Ltd., Global Payments Inc., International Business Machines Corp., NICE Ltd., Oracle Corp., RELX Plc, SAP SE, SAS Institute Inc., SEON Technologies Kft., Software AG, and Visa Inc. Market dynamics Parent market analysis, Market growth inducers and obstacles, Fast-growing and slow-growing segment analysis, COVID-19 impact and recovery analysis and future consumer dynamics, Market condition analysis for forecast period. Customization purview If our report has not included the data that you are looking for, you can reach out to our analysts and get segments customized. Table of Contents Exhibit 14: Chart on Global - Market size and forecast 2022-2027 ($ million) Exhibit 15: Data Table on Global - Market size and forecast 2022-2027 ($ million) Exhibit 16: Chart on Global Market: Year-over-year growth 2022-2027 (%) Exhibit 17: Data Table on Global Market: Year-over-year growth 2022-2027 (%) 4 Historic Market Size 4.1 Global fraud detection and prevention market 2017 - 2021 Exhibit 18: Historic Market Size – Data Table on global fraud detection and prevention market 2017 - 2021 ($ million) 4.2 Component Segment Analysis 2017 - 2021 Exhibit 19: Historic Market Size – Component Segment 2017 - 2021 ($ million) 4.3 End-user Segment Analysis 2017 - 2021 Exhibit 20: Historic Market Size – End-user Segment 2017 - 2021 ($ million) 4.4 Geography Segment Analysis 2017 - 2021 Exhibit 21: Historic Market Size – Geography Segment 2017 - 2021 ($ million) 4.5 Country Segment Analysis 2017 - 2021 Exhibit 22: Historic Market Size – Country Segment 2017 - 2021 ($ million) 5 Five Forces Analysis Exhibit 33: Data Table on Comparison by Component 6.3 Solutions - Market size and forecast 2022-2027 Exhibit 34: Chart on Solutions - Market size and forecast 2022-2027 ($ million) Exhibit 35: Data Table on Solutions - Market size and forecast 2022-2027 ($ million) Exhibit 36: Chart on Solutions - Year-over-year growth 2022-2027 (%) Exhibit 37: Data Table on Solutions - Year-over-year growth 2022-2027 (%) 6.4 Services - Market size and forecast 2022-2027 Exhibit 38: Chart on Services - Market size and forecast 2022-2027 ($ million) Exhibit 39: Data Table on Services - Market size and forecast 2022-2027 ($ million) Exhibit 40: Chart on Services - Year-over-year growth 2022-2027 (%) Exhibit 41: Data Table on Services - Year-over-year growth 2022-2027 (%) 6.5 Market opportunity by Component Exhibit 42: Market opportunity by Component ($ million) Exhibit 43: Data Table on Market opportunity by Component ($ million) 7 Market Segmentation by End-user 7.1 Market segments Exhibit 47: Data Table on Comparison by End-user 7.3 Large enterprise - Market size and forecast 2022-2027 Exhibit 48: Chart on Large enterprise - Market size and forecast 2022-2027 ($ million) Exhibit 49: Data Table on Large enterprise - Market size and forecast 2022-2027 ($ million) Exhibit 50: Chart on Large enterprise - Year-over-year growth 2022-2027 (%) Exhibit 51: Data Table on Large enterprise - Year-over-year growth 2022-2027 (%) 7.4 SMEs - Market size and forecast 2022-2027 Exhibit 52: Chart on SMEs - Market size and forecast 2022-2027 ($ million) Exhibit 53: Data Table on SMEs - Market size and forecast 2022-2027 ($ million) Exhibit 54: Chart on SMEs - Year-over-year growth 2022-2027 (%) Exhibit 55: Data Table on SMEs - Year-over-year growth 2022-2027 (%) 7.5 Market opportunity by End-user Exhibit 56: Market opportunity by End-user ($ million) Exhibit 57: Data Table on Market opportunity by End-user ($ million) 8 Customer Landscape Exhibit 62: Data Table on Geographic comparison 9.3 North America - Market size and forecast 2022-2027 Exhibit 63: Chart on North America - Market size and forecast 2022-2027 ($ million) Exhibit 64: Data Table on North America - Market size and forecast 2022-2027 ($ million) Exhibit 65: Chart on North America - Year-over-year growth 2022-2027 (%) Exhibit 66: Data Table on North America - Year-over-year growth 2022-2027 (%) 9.4 Europe - Market size and forecast 2022-2027 Exhibit 67: Chart on Europe - Market size and forecast 2022-2027 ($ million) Exhibit 68: Data Table on Europe - Market size and forecast 2022-2027 ($ million) Exhibit 69: Chart on Europe - Year-over-year growth 2022-2027 (%) Exhibit 70: Data Table on Europe - Year-over-year growth 2022-2027 (%) 9.5 APAC - Market size and forecast 2022-2027 Exhibit 71: Chart on APAC - Market size and forecast 2022-2027 ($ million) Exhibit 72: Data Table on APAC - Market size and forecast 2022-2027 ($ million) Exhibit 73: Chart on APAC - Year-over-year growth 2022-2027 (%) Exhibit 74: Data Table on APAC - Year-over-year growth 2022-2027 (%) 9.6 South America - Market size and forecast 2022-2027 Exhibit 75: Chart on South America - Market size and forecast 2022-2027 ($ million) Exhibit 76: Data Table on South America - Market size and forecast 2022-2027 ($ million) Exhibit 77: Chart on South America - Year-over-year growth 2022-2027 (%) Exhibit 78: Data Table on South America - Year-over-year growth 2022-2027 (%) 9.7 Middle East and Africa - Market size and forecast 2022-2027 Exhibit 79: Chart on Middle East and Africa - Market size and forecast 2022-2027 ($ million) Exhibit 80: Data Table on Middle East and Africa - Market size and forecast 2022-2027 ($ million) Exhibit 81: Chart on Middle East and Africa - Year-over-year growth 2022-2027 (%) Exhibit 82: Data Table on Middle East and Africa - Year-over-year growth 2022-2027 (%) 9.8 US - Market size and forecast 2022-2027 Exhibit 83: Chart on US - Market size and forecast 2022-2027 ($ million) Exhibit 84: Data Table on US - Market size and forecast 2022-2027 ($ million) Exhibit 85: Chart on US - Year-over-year growth 2022-2027 (%) Exhibit 86: Data Table on US - Year-over-year growth 2022-2027 (%) 9.9 UK - Market size and forecast 2022-2027 Exhibit 87: Chart on UK - Market size and forecast 2022-2027 ($ million) Exhibit 88: Data Table on UK - Market size and forecast 2022-2027 ($ million) Exhibit 89: Chart on UK - Year-over-year growth 2022-2027 (%) Exhibit 90: Data Table on UK - Year-over-year growth 2022-2027 (%) 9.10 Germany - Market size and forecast 2022-2027 Exhibit 91: Chart on Germany - Market size and forecast 2022-2027 ($ million) Exhibit 92: Data Table on Germany - Market size and forecast 2022-2027 ($ million) Exhibit 93: Chart on Germany - Year-over-year growth 2022-2027 (%) Exhibit 94: Data Table on Germany - Year-over-year growth 2022-2027 (%) 9.11 China - Market size and forecast 2022-2027 Exhibit 95: Chart on China - Market size and forecast 2022-2027 ($ million) Exhibit 96: Data Table on China - Market size and forecast 2022-2027 ($ million) Exhibit 97: Chart on China - Year-over-year growth 2022-2027 (%) Exhibit 98: Data Table on China - Year-over-year growth 2022-2027 (%) 9.12 Japan - Market size and forecast 2022-2027 Exhibit 99: Chart on Japan - Market size and forecast 2022-2027 ($ million) Exhibit 100: Data Table on Japan - Market size and forecast 2022-2027 ($ million) Exhibit 101: Chart on Japan - Year-over-year growth 2022-2027 (%) Exhibit 102: Data Table on Japan - Year-over-year growth 2022-2027 (%) 9.13 Market opportunity by geography Exhibit 103: Market opportunity by geography ($ million) Exhibit 104: Data Tables on Market opportunity by geography ($ million) 10 Drivers, Challenges, and Trends 10.1 Market drivers About Us Technavio is a leading global technology research and advisory company. Their research and analysis focus on emerging market trends and provide actionable insights to help businesses identify market opportunities and develop effective strategies to optimize their market positions. With over 500 specialized analysts, Technavio's report library consists of more than 17,000 reports and counting, covering 800 technologies, spanning 50 countries. Their client base consists of enterprises of all sizes, including more than 100 Fortune 500 companies. This growing client base relies on Technavio's comprehensive coverage, extensive research, and actionable market insights to identify opportunities in existing and potential markets and assess their competitive positions within changing market scenarios. Contact
SEON Technologies Frequently Asked Questions (FAQ)
When was SEON Technologies founded?
SEON Technologies was founded in 2017.
Where is SEON Technologies's headquarters?
SEON Technologies's headquarters is located at Rákóczi út 42. 7. em, Budapest.
What is SEON Technologies's latest funding round?
SEON Technologies's latest funding round is Incubator/Accelerator - II.
How much did SEON Technologies raise?
SEON Technologies raised a total of $106.62M.
Who are the investors of SEON Technologies?
Investors of SEON Technologies include AWS ISV Accelerate Program, PortfoLion, Creandum, Plug and Play Ventures, AME Ventures and 17 more.
Who are SEON Technologies's competitors?
Competitors of SEON Technologies include Featurespace, Jeff App, Fraud.net, FUGU, Huntli and 7 more.
What products does SEON Technologies offer?
SEON Technologies's products include Intelligence Tool and 1 more.
Who are SEON Technologies's customers?
Customers of SEON Technologies include FairMoney, Air France, Xcoins, Patreon and Albo.
Loading...
Compare SEON Technologies to Competitors

Signifyd provides e-commerce fraud protection and prevention services. The company offers services, including revenue protection, abuse prevention, and payment compliance, all aimed at maximizing conversion and eliminating fraud and consumer abuse. Its services primarily cater to the e-commerce industry. Signifyd was founded in 2011 and is based in San Jose, California.

Shield is a device-first risk AI platform specializing in fraud prevention and risk intelligence within the digital business sector. The company offers solutions to identify and eliminate fraudulent activities through global standard device identification and actionable risk intelligence. Shield primarily serves industries such as ride-hailing, social media, e-commerce, digital banking, and gaming. Shield was formerly known as CashShield. It was founded in 2008 and is based in Singapore, Singapore.

Resistant AI deals with automated financial risk and compliance systems. It offers products such as document forensics, which authenticates documents with artificial intelligence (AI) to detect fraud, and transactions forensics, which helps simplify fraud detection, algebraic modeling language (AML), and scoring system. Resistant AI was formerly known as Bulletproof AI. The company was founded in 2019 and is based in Prague, Czech Republic.
Accertify focuses on digital identity and financial fraud risk management, operating within the financial technology sector. The company offers services such as digital identity verification, fraud prevention, chargeback management, and payment gateway solutions. Its primary customer base includes organizations seeking to protect their digital identities and mitigate financial fraud risks. It was founded in 2007 and is based in Schaumburg, Illinois.
Corgi Labs specializes in artificial intelligence (AI) driven payment optimization and fraud prevention within the financial technology sector. The company offers a plug-and-play software as a solution (SaaS) that provides businesses with machine learning models for fraud control, centralized analytics dashboards, and expert support to enhance transaction acceptance and reduce fraud losses. Corgi Labs primarily serves sectors that require online payment processing, such as e-commerce, digital banking, and online gaming. It was founded in 2022 and is based in Beaverton, Oregon.

DataVisor is a company focused on fraud and risk management within the financial technology sector. They offer an AI-powered SaaS platform that provides enterprise-level fraud prevention and AML compliance solutions. The company primarily serves financial institutions and large organizations, offering a suite of tools to combat various types of fraud and financial crimes. It was founded in 2013 and is based in Mountain View, California.
Loading...